Case Shiller Confirms Importance Of LOCAL Home Price Analysis
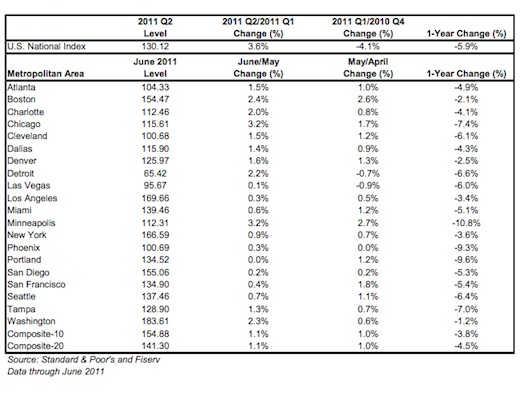
Case Shiller’s June report showed home prices across 20 major U.S. metro areas were up 1.1% since May, the third straight monthly ’20-City’ gain after seven months of decline. But prices are down 4.5% since last June, and prices are down drastically from 2006 highs and now at 2003 levels (charts below).
Here’s the most important note from today’s Case Shiller home price report—from chairman of S&P’s index committee David Blitzer:
…we are back to regional housing markets, rather than a national housing market where everything rose and fell together.
Blitzer’s comment properly acknowledges that real estate is local. Macro research like Case Shiller data helps, but it’s not entirely accurate for your local market decision making. Homebuyers using Case Shiller to price a home is like investors using sector data to price a stock. It’s one input, but local analysis is more important for property selection and offer strategy.
Homebuyers are justifiably waiting for some kind of bottom. To make good decisions on whether a bottom is here or near, buyers need hyper-local analysis from realtors on the ground in their specific target areas. This is confirmed by Blitzer’s statement today.
There are deals in any market, but it’s street-to-street analysis, not city-to-city.
Here’s one good comment from South Carolina Realtor Mark Brian on how he combines Case Shiller data with his local market analysis:
I use reports such as Case Shiller to compare and contrast to my market’s statistics. Local data such as for a city or county is not always specific enough. I feel that you have to look at each individual home and compare to recent sold comps and active listings to get a better idea about the value of that home. The market reports I like to give for a certain area are good for starting to understand the local market, but not for knowing how much to offer or the best possible list price.
It’s also worth noting that Case Shiller’s 10- and 20- “City” composites aren’t cities. They’re broad regions or “Metropolitan Statistical Areas” (MSAs). For example, “San Francisco” in the table below is a five county region, and the actual city of San Francisco contains only 12% of the house inventory in the MSA, so the aggregate Index is heavily skewed toward the other counties’ markets.
Here’s some relevant analysis on this topic from Paragon Real Estate Group—it’s specific to San Francisco, but you can see your region’s fine print here.


