Home Prices Up Last 4 Months, But Here’s Fine Print
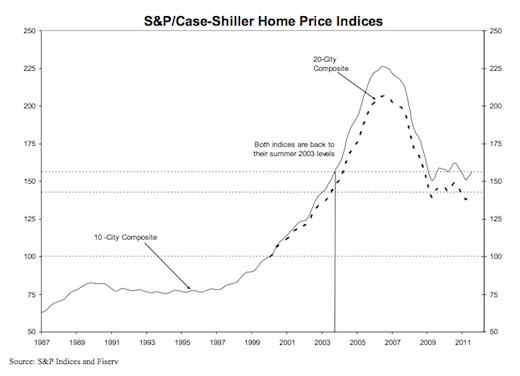
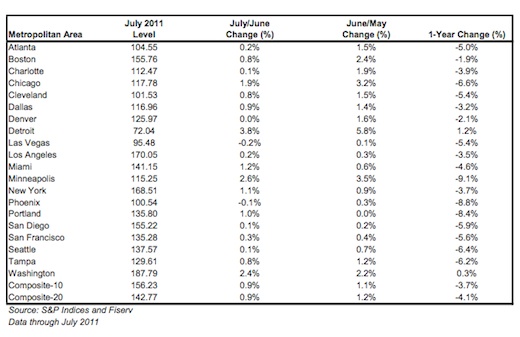
Case Shiller’s July report showed home prices across 20 major U.S. metro areas were up 0.9% since June, the fourth straight monthly ’20-City’ gain after seven months of decline. But prices are down 4.1% since last July, and prices are down drastically from 2006 highs and now at 2003 levels (CHARTS BELOW).
Chairman of S&P’s index committee David Blitzer was encouraged by the improving trend but cautioned:
Continued increases in home prices through the end of the year and better annual results must materialize before we can confirm a housing market recovery.
It’s also worth going back to what Blitzer said last month:
…we are back to regional housing markets, rather than a national housing market where everything rose and fell together.
As I discussed then, Blitzer’s comment properly acknowledges that real estate is local. Here are my comments which still hold:
Macro research like Case Shiller data helps, but it’s not entirely accurate for your local market decision making. Homebuyers using Case Shiller to price a home is like investors using sector data to price a stock. It’s one input, but local analysis is more important for property selection and offer strategy.
Homebuyers are justifiably waiting for some kind of bottom. To make good decisions on whether a bottom is here or near, buyers need hyper-local analysis from realtors on the ground in their specific target areas. This is confirmed by Blitzer’s statement today.
There are deals in any market, but it’s street-to-street analysis, not city-to-city.
Last month’s write-up also includes critical insights from a Realtor on this topic, explaining how he combines Case Shiller with local analysis to advise clients.
It’s also worth noting that Case Shiller’s 10- and 20- “City” composites aren’t cities. They’re broad regions or “Metropolitan Statistical Areas” (MSAs). For example, “San Francisco” in the table below is a five county region, and the actual city of San Francisco contains only 12% of the house inventory in the MSA, so the aggregate Index is heavily skewed toward the other counties’ markets.
Here’s S&P’s methodology for each of their MSAs.

___
Source:
S&P Case Shiller July Home Price Report

