Homebuilder Confidence Spikes. Here’s Historical Context.
Rates are even to up slightly after today’s U.S. economic fundamentals. Consumer inflation flat. Chain store sales flat, which was a welcome change from yesterday’s disappointing retail sales. And most notably today was a spike in homebuilder confidence. Full summary of that and all today’s data below.
In addition, Bernanke started his two-day Capitol Hill testimony and Q&A this morning, and his refrain of “frustratingly slow” progress on U.S. unemployment plus Europe putting a drag on U.S. growth underscores why housing, while improving, still has a long way to go.
Following the NAHB homebuilder confidence report below, the next housing reports are June housing starts (construction) tomorrow and June existing home sales Thursday.
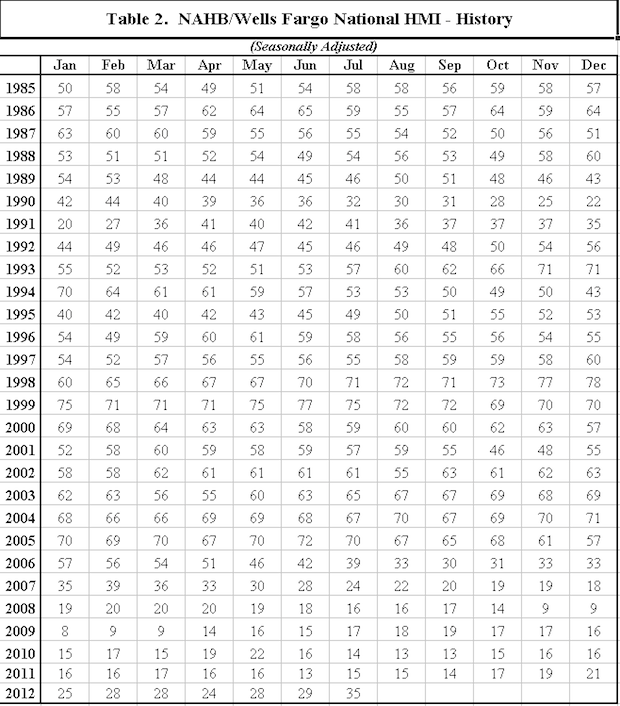
National Association of Homebuilders Confidence Index (July 2012)
– National Association of Homebuilders July index is 35, up from 29 in June
– Highest since March 2007
– Big jump but still way off from 50+ considered to be healthy market
– 50 is dividing line between positive and negative sentiment
– Last 50+ reading was April 2006, the tail end of the housing boom
– Until the jobs market improves, housing demand will be restrained
– Full July 2012 report
– Here’s a table showing builder confidence from 1985-PRESENT
Consumer Inflation (June 2012)
– CPI core (less food & energy), Month/Month +0.2%. Year/Year +2.2%
– CPI (overall), Month/Month +0.0%. Year/Year +1.7%
Inflation remains subdued. Extremely accommodative monetary policy has not led to increased demand keeping prices well contained.
Industrial Production (June 2012)
– Industrial Production, Month/Month +0.4%
– Capacity Utilization Rate 78.9%
– Manufacturing, Month/Month 0.7%
Prior IP was revised down to -0.2% making for a net +0.2% for the past two months. After the weak Retail Sales data of yesterday it seems likely that the supply side will have to slow.
Chain Store Sales (week ended 7/14/2012)
– ISCS Goldman Store Sales, Week/Week +0.0%
– ISCS Goldman Store Sales, Year/Year +2.6%
– Redbook Store Sales Year/Year change 1.7%. Previous was +2.2%,
This Chain Store data is more current that yesterday’s disappointing Retail Sales and indicates very flat GDP.

