Housing & GDP: From Headwind to Tailwind – by Goldman Sachs
[Housing report written last week by Goldman Sachs economics team…]
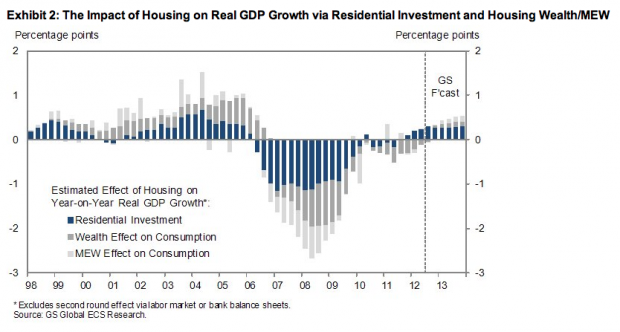
Over the last year, the housing sector has turned from a headwind to GDP growth into a tailwind. Combining the direct impact of residential investment and the indirect impact of housing wealth and mortgage equity withdrawal (MEW) on consumption, we estimate that housing subtracted around 1/4 percentage point from real GDP growth in 2010 and 2011, is currently adding around 1/4 point, and could add around 1/2 point in 2013. Multiplier effects via the labor market and bank balance sheets might add slightly to this boost.
However, it is important to keep the improvement in perspective. Housing is likely to remain less important from a macroeconomic perspective than in the prior cycle, when the combined impact of residential investment and the wealth/MEW effect on consumption ranged from +1 percentage point in 2003-2005 to -2.5 points in 2008. This contrast is probably even more pronounced when multiplier effects are considered.
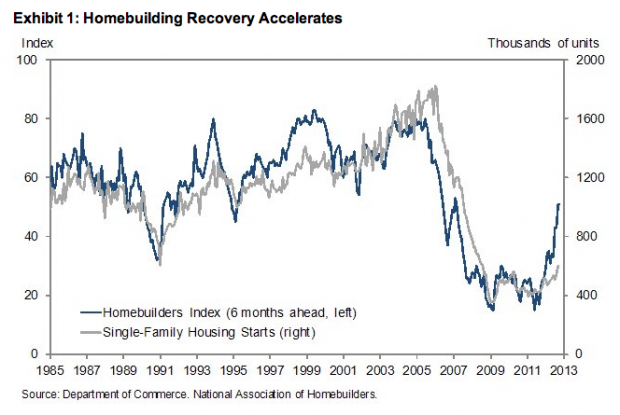
The housing recovery has gained steam in recent months. As shown in Exhibit 1, the homebuilders index—a monthly survey on whether various aspects of the market are “good” or “bad”—has surged from the all-time lows prevailing in 2008 -2011 to a level only modestly below the historical average. Housing starts have not risen as much, but the 15% month-to-month increase in September suggests that the catch-up may be accelerating. House prices also continue to improve.
From a macroeconomic perspective, a key question is the impact of this recovery on real GDP growth. We have looked at this issue repeatedly over the years, both prior to the 2007-2009 recession and subsequently. There are different ways to split the aggregate GDP impact, but a simple approach is to focus on three broad categories:
1. The direct GDP contribution from residential investment, which includes construction of new homes, improvements and alterations, and broker commissions on sales of new and existing homes.
2. The consumption impact of changes in housing wealth and active mortgage equity withdrawal (MEW), defined as cash-out refinancing and home equity borrowing.
3. Multiplier effects from changes in residential investment or housing wealth/MEW via the labor market, bank balance sheets, consumer confidence, and adjacent sectors such as furniture purchases.
Today we focus on providing a quantitative estimate of the first two effects and a brief qualitative discussion of the third one. Exhibit 2 shows our estimates of the residential investment and consumption impacts since the late 1990s on a 4-quarter average basis, as well as our estimates through the end of 2013. The residential investment impact is taken directly from the GDP accounts, and the projection is based on our forecast that real residential investment growth will accelerate from 10.4% year-on-year in 2012Q2 to 13% in 2013Q4. The consumption impact via housing wealth and MEW is based on the consumption function estimated in our 2006 paper “Housing Holds the Key to Fed Policy” adjusted for the “leakage” from consumption into changes in net exports. In order to project these effects forward, we assume that house prices grow at a 2% pace from mid-2012 to mid-2013 and a 2.8% pace thereafter, in line with our most recent forecast. This is a bit slower than the most recent year-on-year growth pace, but the impact on consumption and GDP growth nevertheless turns more positive due to the lags between wealth and spending. We also assume that MEW gradually turns less negative, although the impact on consumption growth remains minor.
Exhibit 2 makes three broad points. First, the impact of housing is shifting into positive territory. The overall impact averaged around -1/4 percentage point in 2010-2011, stands at around +1/4 point now, and is likely to increase to +1/2 point in 2013. These numbers are equivalent to a move from a depressed housing market to a “normal expansion” as we defined it late last year, although they still fall well short of a “boom.” (These terms are all defined with respect to the growth contribution of housing; in level terms, housing still remains far short of normal, especially as far as residential investment is concerned.)
Second, most of the positive contribution to growth has so far come from the direct impact of residential investment, which we expect to contribute around 0.3 percentage points to growth next year. However, the wealth effect is also starting to contribute to the improvement as the swing from continued house price declines in 2010-2011 to house price gains in 2012 gradually makes itself felt in consumption.
Third, it is important to keep the improvement in perspective. Housing is likely to remain less important from a macroeconomic perspective than in the prior cycle, when the combined impact of residential investment and the wealth/MEW effect on consumption ranged from +1 percentage point in 2003-2005 to -2.5 points in 2008.
The contrast between this cycle and the preceding one is likely to be even more pronounced if we consider multiplier effects via bank balance sheets or the labor market, which are not formally included in Exhibit 2. These were extremely important in the prior cycle but are probably less important now, at least over the next year or two. The bank balance sheet multiplier—which we referred to as the impact of “leveraged losses” back in 2007—has been turning more positive as the improvement in mortgage credit quality has helped the bank balance sheet repair process and probably contributed to the gradual easing in lending standards. However, judging from the Fed’s Senior Loan Officers survey and the weekly bank balance sheet statistics, there is not much evidence for a meaningful acceleration in this easing process. We suspect it has been contributing positively to GDP growth for the last couple of years, but only to a modest degree.
The labor market multiplier is a bit easier to measure, but is probably also fairly limited at present. Payroll employment in the key housing-related sectors—residential construction, residential specialty trader contractors, mortgage banking, and real estate brokerage—currently stands at 2.6 million and has risen 0.9% over the past year, slightly slower than overall employment. We would expect employment growth to accelerate in this area as residential construction, in particular, recovers from the slump, and this could add 0.1 percentage point or so to household income growth.
___
Housing Stocks:
– Builders: $XHB, $MHO, $PHM, $LEN, $TOL, $NVR, $DHI, $SPF, $RYL, $KBH, $MHT, $MDC
– REITs: $AVB, $EQR, $UDR, $NLY, $CIM
– Other Real Estate Stocks: $RLGY, $Z, $TRLA, $CSGP, $AWAY, $MOVE, $LEDR, $ZIPR


