WeeklyBasis: Rates Get High (with a little help from my friends)
Rates ended last week .375% higher than record lows last touched January 15-16. We were in that record low range for much of the fourth quarter, then rates rose .125% early January, dipped back down those two days, then rose .375% since then.
There’s no compelling evidence we’ll see those record levels again soon because moderately improving U.S. economic and fiscal outlooks have driven Treasury and mortgage bonds (MBS) to sell past important technical levels (rates rise when bond prices drop in selloffs).
This is an important point for rate shoppers holding for better. Because there’s no difference between “holding” and “hoping” if you’re not up on your research. My friend Josh Brown, investment advisor and financial pundit, underscored this point on Twitter recently, joking:
How do you know when a daytrader is caught in a losing position? He starts researching the company.
— Downtown Josh Brown (@ReformedBroker) January 23, 2013
Some rate shoppers are the same. But it’s not just as simple as “rates drop on bad economic news” and vice versa. If that was true, rates would have dropped when the BEA reported last week that 4Q GDP contracted. Instead, rates held higher levels because the technicals (aka trading activity and trends) are setting the tone.
To see what I mean, first look at these longer-term trends in the 10yr Note and the Fannie Mae 30yr 3% coupon. The 10yr Note is a guide for Fannie 3s, which are a guide for mortgage rates. And the trend supports these higher rate levels.
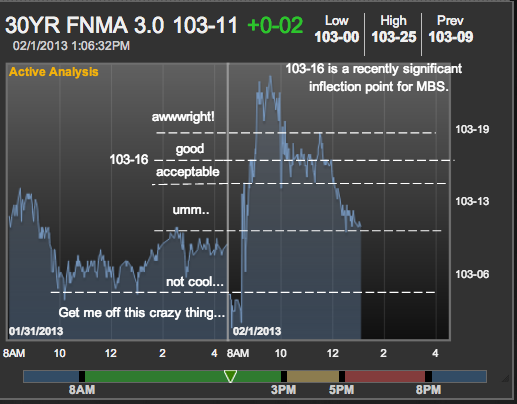
Then look at a more immediate term example from MBS analyst Matt Graham at MortgageNewsDaily, who diagrammed the Friday’s Fannie 3% coupon chart* below as a joke, but it works because it’s in terms we can all understand.
As you can see, MBS opened materially better (rates down) Friday morning after the mediocre January jobs report, then reversed to end the day in the red (rates up). This chart image was taken was before the final closing price of 103-05, which is right on the “Not Cool” line and 4 ticks (13 basis points) lower than Thursday’s close.
Looking into next week, here are two things to consider:
(1) This rate spike may level off if Fannie 3s can hold 103-05 and the 10yr Note yield can hold at the 2.04% support level (it closed Friday at 2.02%). Here’s a word from the Reuters IFR MBS team about next week:
Now that nonfarm payrolls is revealed and bonds rallied on the uptick in unemployment while obscuring the upward revisions in employment in November and December on top of an in line print for January, MBS may see relief. Lower yields and lower vols should allow them to trade to a supportive direction — seemingly free of extension risk as America’s coupons are still in play. The market has obeyed directionality of late and the coming week should be no exception.
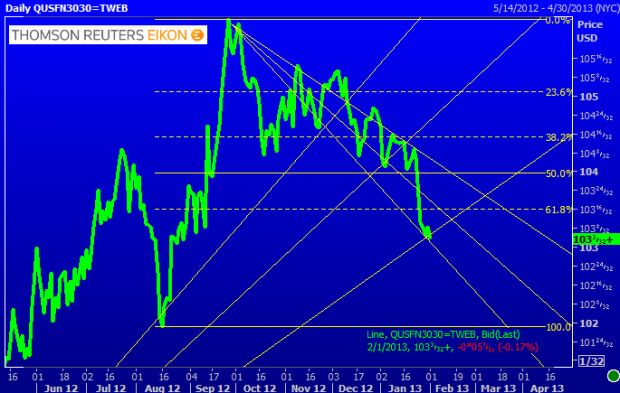
Conversely you can see from the chart below (via @AQ_MND at Reuters) that Fannie 3s are holding at very important support, so a continued selloff leading to higher rates is still possible.
Also it’s worth noting that the rate spike applies to conventional loans in the first two “conforming” tiers (the loans to $417,000 and to $625,500). The jumbo loans from $625,501 to $2m and the FHA loans are more steady because market conditions for those loans are a bit more favorable. For example, FHA rates haven’t risen (yet) during this spike, and jumbo rates are only up about .125%.
(2) At sub-4% for all rate tiers, rates are still insanely low. But refinancers need to wake up and take action before it gets worse, as I explained on CNBC last week. As for home buyers, they can’t lock a loan until they’re in contract to buy a property anyway. And for home buyers doing their research, I’m adding a good link on rent vs. buy analysis below.
___
Reference:
– Is The Refi Apocalypse Really Upon Us? (CNBC + me)
– How Do To Your Own Rent vs. Buy Math
*Used with permission from MBS Live


