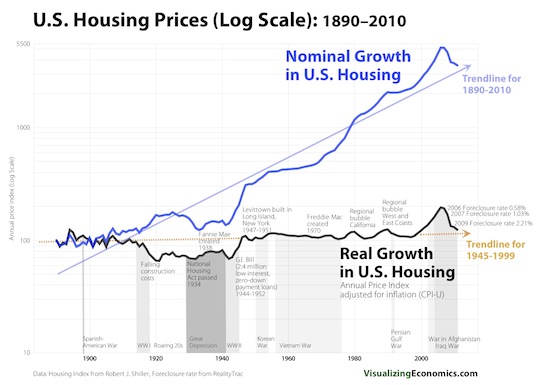
CHART: Home Prices 1890-2010
This great home price chart from VisualizingEconomics (via Barry Ritholtz) speaks for itself, but below chart is a description from VisualizingEconomics clarifying whether a home seller should be looking at inflation adjusted (real) versus not inflation adjusted (nominal) prices. Click for full size.
A $10,000 house in 1890 would be worth almost the same in real dollars in 2010 but more than $350,000 in nominal dollars in 2010. Which matters to the home seller, real or nominal prices? If a seller is holding a mortgage then the question is: Can I sell for more or less than I owe? Since that loan amount is not adjusted for inflation then the nominal value is more importent both the seller and the mortgage holder. It is when nominal prices fall that banks have trouble with high rates of mortgage defaults. But if you are looking at the long-term value of real estate as an investment (compared to stocks or bonds) then you need to take into account the real growth.

