Home Prices Down 1.6% vs. Year Ago, Down 30.3% From July 2006 Peak. (CHARTS)
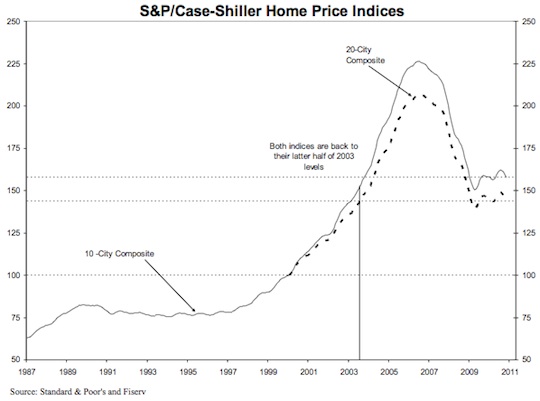
The S&P Case Shiller November 2010 report of existing home sales showed average U.S. home prices declined 1.6% from November 2009. This is the sixth consecutive month of weaker data, which reflects sustained foreclosure volumes, high unemployment, and the drop off in activity following the federal homebuyer tax credit expiration. Home prices are down 30.3% from their July 2006 peak, and are at similar levels to what they were in late-2003. Two graphics that tell this story are shown below, as is the full press release.
Case Shiller November 2010 Home Price Results


The index tracks existing single family homes, and is a credible pricing barometer for broad market analysis because it excludes condos and new construction. Condos can have more volatile pricing, and new construction pricing can be artificially set by builders, especially in times of distress when discounts an incentives can skew pricing. S&P refers to 10 and 20 “City” Composites, but these are actually metropolitan regional areas, not just cities. For example, where the city says San Francisco, this isn’t just San Francisco, but rather 5 counties in the Bay Area region (see page 9 of this PDF): Alameda, Contra Costa, Marin, San Francisco, San Mateo.
FULL TEXT FROM PRESS RELEASE
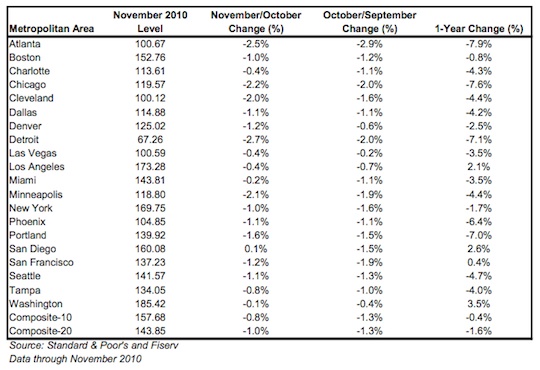
Data through November 2010, released today by Standard & Poor’s for its S&P/Case-Shiller Home Price Indices, the leading measure of U.S. home prices, show a deceleration in the annual growth rates in 17 of the 20 MSAs and the 10- and 20-City Composites compared to what was reported for October 2010. The 10-City Composite was down 0.4% and the 20-City Composite fell 1.6% from their November 2009 levels. Home prices fell in 19 of 20 MSAs and both Composites in November from their October levels. In November, only four MSAs – Los Angeles, San Diego, San Francisco and Washington DC – showed year-over-year gains. The Composite indices remain above their spring 2009 lows; however, eight markets – Atlanta, Charlotte, Detroit, Las Vegas, Miami, Portland (OR), Seattle and Tampa – hit their lowest levels since home prices peaked in 2006 and 2007, meaning that average home prices in those markets have fallen even further than the lows set in the spring of 2009.
The chart above depicts the annual returns of the 10-City and the 20-City Composite Home Price Indices. In November 2010, the 10-City and 20-City Composites recorded annual returns of -0.4% and -1.6%, respectively. November was the sixth consecutive month where the annual growth rates moderated from their prior month’s pace. Since May 2010, the housing market has experienced an unambiguous deceleration in home price returns. The 10-City Composite has reentered negative territory with a -0.4% annual growth rate in November, versus the +5.4% reported six months prior in May, and the 20-City Composite was down 1.6% in November versus its +4.6% May print.
“With these numbers more analysts will be calling for a double-dip in home prices. Let’s take a moment to define a double-dip as seeing the 10- and 20-City Composites set new post-peak lows. The series are now only 4.8% and 3.3% above their April 2009 lows, suggesting that a double-dip could be confirmed before Spring. Certainly eight cities setting new lows, and with the only positive news concentrated in southern California and Washington DC, the data point to weakness in home prices,” says David M. Blitzer, Chairman of the Index Committee at Standard & Poor’s. “With an annual growth rate of +3.5% in November, Washington DC was the strongest market, but still well below the +7.7% annual rate of growth seen in May 2010. The only city with a gain in November was San Diego, up a scant 0.1%. While San Diego, Los Angeles and San Francisco are still ahead from November 2009, their annual rates are shrinking in recent months.
“Looking at the monthly statistics, 19 of 20 MSAs and both Composites were down in November over October. Fourteen MSAs and both composites have posted at least four consecutive months of decline with November’s report. Thirteen of the MSAs and the 20-City Composite fell by 1.0% or more in November. While not always consecutive months, 13 of the MSAs and both composites have posted at least seven months of decline since the beginning of 2010. These markets saw home prices fall more than half the months reported in 2010 so far.”
The chart above shows the index levels for the 10-City and 20-City Composite Indices. As of November 2010, average home prices across the United States are back to the levels where they were in latter half of 2003. Measured from June/July 2006 through November 2010, the peak-to-current decline for both the 10-City Composite and 20-City Composite is -30.3%. The improvements from their April 2009 trough are +4.8% and +3.3%, respectively.
The 10 City Composite was down 0.8% and the 20-City Composite fell by 1.0% in November. Nineteen of 20 of the metro areas also declined in November; San Diego was up just 0.1%. Thirteen of the MSAs were down by 1.0% or more in November, with Detroit posting the largest decline of 2.7%.
As of November 2010, Las Vegas is down 57.2% from its peak in August 2006; Phoenix is 53.9% down from its peak on June 2006 and Miami is 48.8% down from its peak on December 2006.
