Home Prices up (CHARTS)
Housing
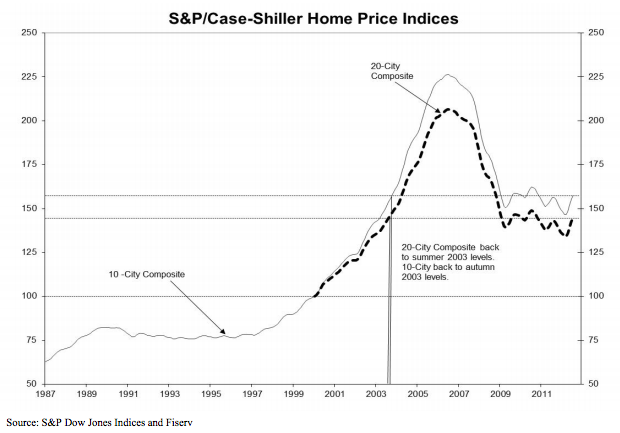
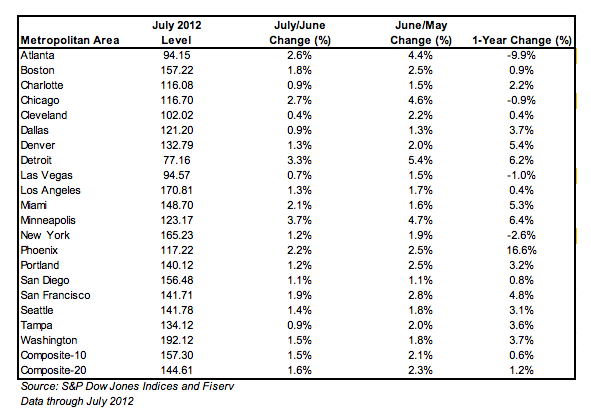
S&P/Case-Shiller Home Price Index (July 2012)
20-city – Month/Month +0.4%. Previous was 0.9%
20-city – Month/Month 1.6 %. Previous was 2.3%
20-city – Year/Year 1.2 %. Previous was +0.6%
All data are seasonally adjusted. Home prices are increasing but at a slower rate. This report is the sixth consecutive one showing higher prices.
July chart/table below, and full July Case Shiller report here.
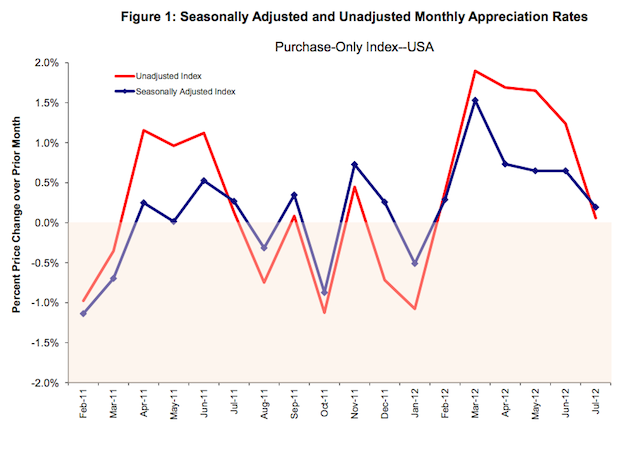
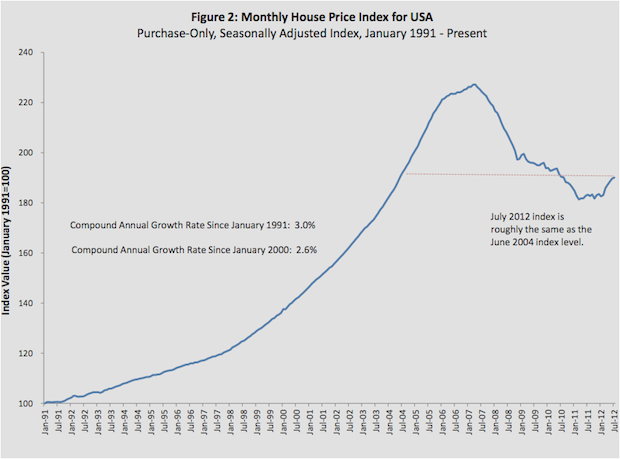
FHFA Price Index (July 2012)
Month/Month change 0.2%. Previous was revised to +0.6%
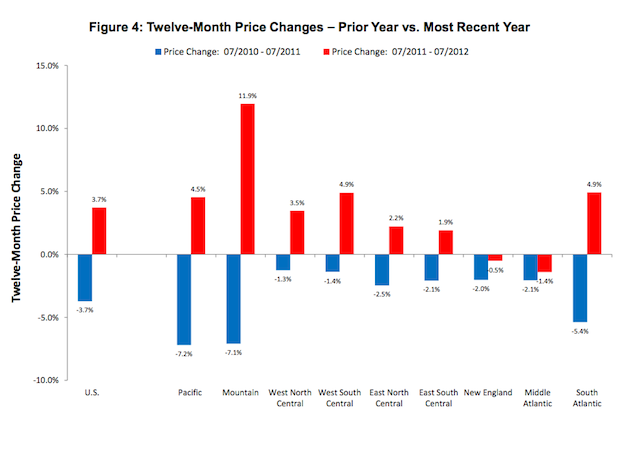
Year/Year change 3.7 %. Previous was revised to +3.8%.
While these reports show gains and consequently stability to prices, the gains are smaller than previous and below expectations. It will still take years for Housing Starts to return the the 1,500,000 needed to keep pace with population growth.
July charts below and full July FHFA report here
Consumer Confidence (September 2012)
Confidence Level is 70.3 a nice move up from the previous (revised ) 61.3. This is the index from the Conference Board.
Chain Store Sales (week ended 9/22/2012)
ICSC-Goldman
Store Sales – Week/Week change 0.6%
Store Sales – Year/Year change 2.9%
Redbook
Store Sales Year/Year change 2.0 %. Previous was +2.4%.
Richmond Federal Reserve Manufacturing Index (September 2012)
Index Level was 4. Previous was -9.

