Key Housing Data/Charts Released In August
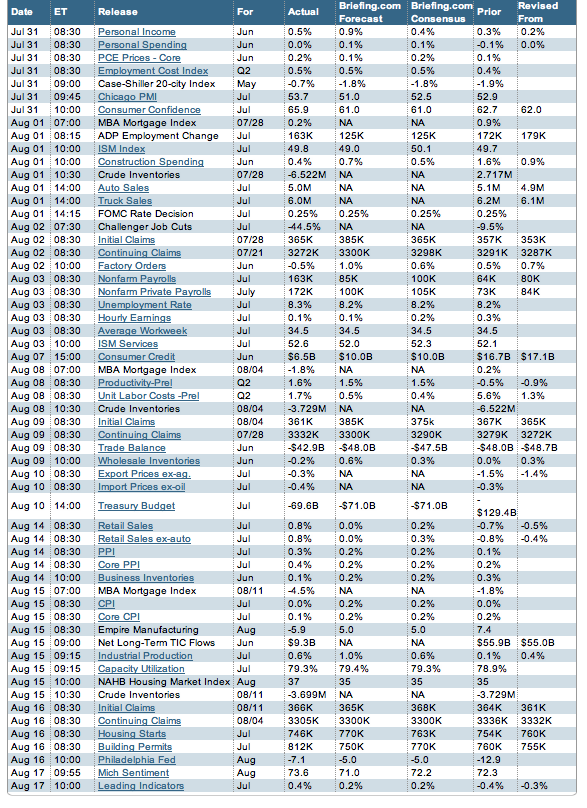
Here’s a snapshot of key U.S. economic fundamentals released so far in August, which are generally less bad, leading to higher stocks and lower bonds (which pushes rates up) as expectations of more imminent Fed stimulus wane.
Also below are individual summaries of key housing data released so far in August. There are some bright spots, but again, it’s more appropriate to call these stats “less bad” rather than good. Still, the market perception is that if the road to recovery runs through housing, then even mediocre is good. For now, this means higher rates. More on rate/MBS markets tomorrow.
U.S. FUNDAMENTALS: JULY 31 – AUGUST 17 (from Briefing.com, click table for details)

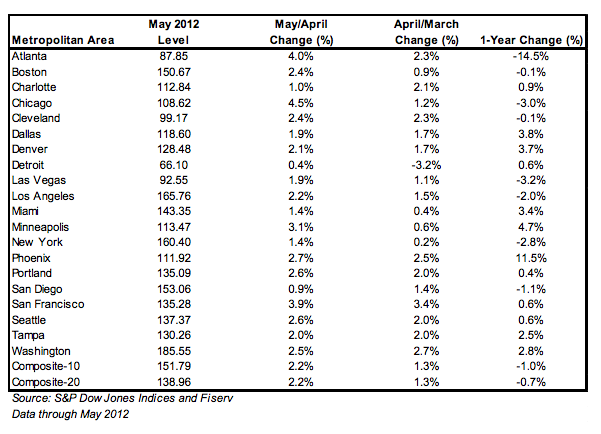
S&P Case-Shiller Home Price Index (for May 2012, released 7/31)
– 20-city, Seasonally Adjusted, Month/Month 0.9%
– 20-city, Not Seasonally Adjusted, Month/Month 2.2%
– 20-city, Not Seasonally Adjusted, Year/Year -0.7%
– This is third consecutive gain in this index
– But remember: these prices are 5-6 months old the day they’re released. Here’s why.
– Full report here, and key charts below
CoreLogic Home Prices (for June 2012, released 8/7)
– Home prices Year/Year +2.5%
– Fourth consecutive monthly increase in month/month and year/year home prices
– Full report has pricing for distressed vs. non-distressed homes.
– A key contributor to rising prices is the fact that inventory is still restrained by would-be sellers being underwater and shadow inventory of homes destined for foreclosure.
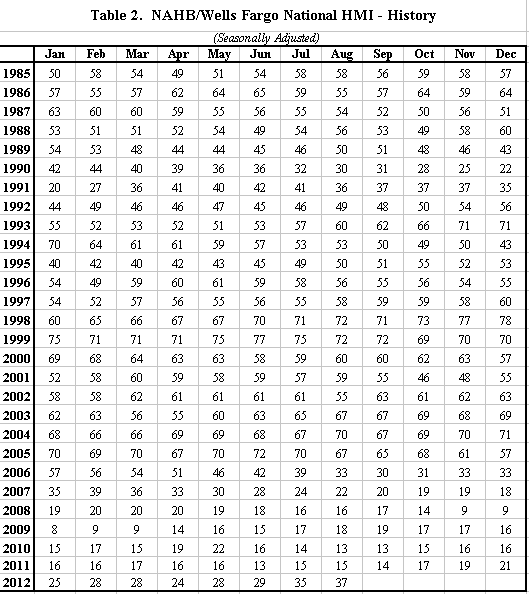
National Association of Homebuilders Confidence Index (August 2012)
– NAHB August index is 37, up from 35 in July and 29 in June
– Highest since March 2007
– Nice improvement but still a ways off from 50+ considered to be healthy market
– 50 is dividing line between positive and negative sentiment
– Last 50+ reading was April 2006, the tail end of the housing boom
– Full August 2012 report
– Here’s a table showing builder confidence from 1985-PRESENT
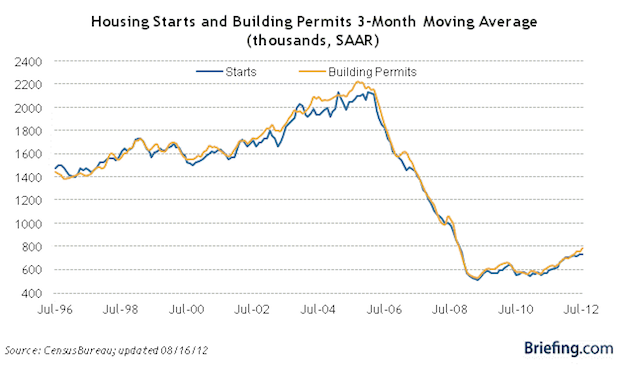
Housing Starts (aka New Construction) and Building Permits (July 2012)
– Permits 812,000 (Seasonally Adjusted Annualized), Previous was 760,000
– Starts 746,000 (Seasonally Adjusted Annualized), Previous was 754,000
– Starts down 1.1% but permits up 6.8%
– First time Permits exceeded 800k since August 2008, a good sign
– As for Starts, still off: we need 1.5m/year to keep pace with population growth
– Single-family Starts were down 6.5% to 502k in July, lowest since March
– The table below puts things into perspective
MBA Mortgage Applications (week ended 8/10/2012)
– Purchase Index, Week/Week -2.0%
– Refinance Index, Week/Week -5.0%
– Composite Index, Week/Week -4.5%
– Refis are down because rate are up, but that purchase index indicates housing weakness. This purchase index hasn’t shown any reliable signs of strength recently.
Next week we get New and Existing Home Sales, which also provide some price data.
___
Also See:
– Which homebuilder stocks are bullish/bearish – CHARTS (Greg Harmon, DragonflyCapital)


