
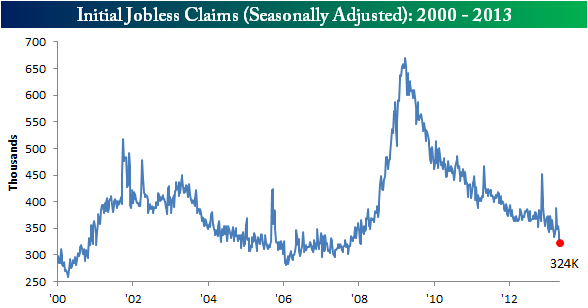
Lowest Initial Jobless Since January 2008.
Initial Jobless Claims (week ended 4/27/2013)
– New Claims 324,000. Previous was 339,000
– 4-week Moving Average (seasonally adjusted) 342,250. Previous was 357,000.
– New Claims (unadjusted) were 298,692, a decrease of -27,143 from the previous week. There were 333,476 initial claims in the comparable week in 2012.
This is the lowest Initial Jobless Claims data since January 2008.
This constitutes back-to-back positive weeks for jobs data neither of which will count in tomorrow’s BLS report but are good omens for next month’s report. Keep in mind also while layoffs may be down, jobs will not improve unless more people are hired than laid off.
When we look at the overall jobs market we need to account for the fact that we are still in a transition period where jobs continue to be offshored or replaced by automation. In the long term we need to have people educated or trained for tomorrow’s jobs.
Here’s a chart from Bespoke.
Challenger Job-Cut Report (April 2013)
– Announced Layoffs 38,121. Previous month was 49,255. This bit of data is not easy to translate into anything meaningful. The layoffs can be short-term or up to a year from now and can be actual layoffs of attrition. These are corporate layoff and do not include small businesses which are the source of most jobs growth.
International Trade (March 2013)
– Deficit was $38.8 billion down from the previous $43.0 billion. Both exports and imports were down. In the medium term the softness of the economies in the EU will hurt exports and if the Euro/U.S. dollar exchange rate remains depressed then U.S. goods will be more expensive to those in the EU. In terms of numbers we should like to see the Euro stay in the $1.30-$1.40 range. Currency instability is the bane of exporters.
Worker Productivity and Costs (1stQ2013)
– Nonfarm productivity – Quarter/Quarter (seasonally adjusted, annualized) +0.7%. Previous was -1.9%
– Unit labor costs – Quarter/Quarter (seasonally adjusted, annualized) +0.5%. Previous was 4.6%.
– Productivity is GDP/hours worked. The quarter reported here is the 1st quarter of the current year. It looks “average.” The previous quarter made little sense to me.
Follow me on Twitter @dicklepre or receive my free weekly newsletter.