
Pending home sales & home price data one-two punch of good news for homebuyers and sellers
If you pride yourself on being the Smart One at the office, there are two just-released economic data points you need to know today. Pending home sales and a key home price index are hot off the presses.
We’ll break both down for you so you can seem so smart your boss will just assume you’re doing your work.
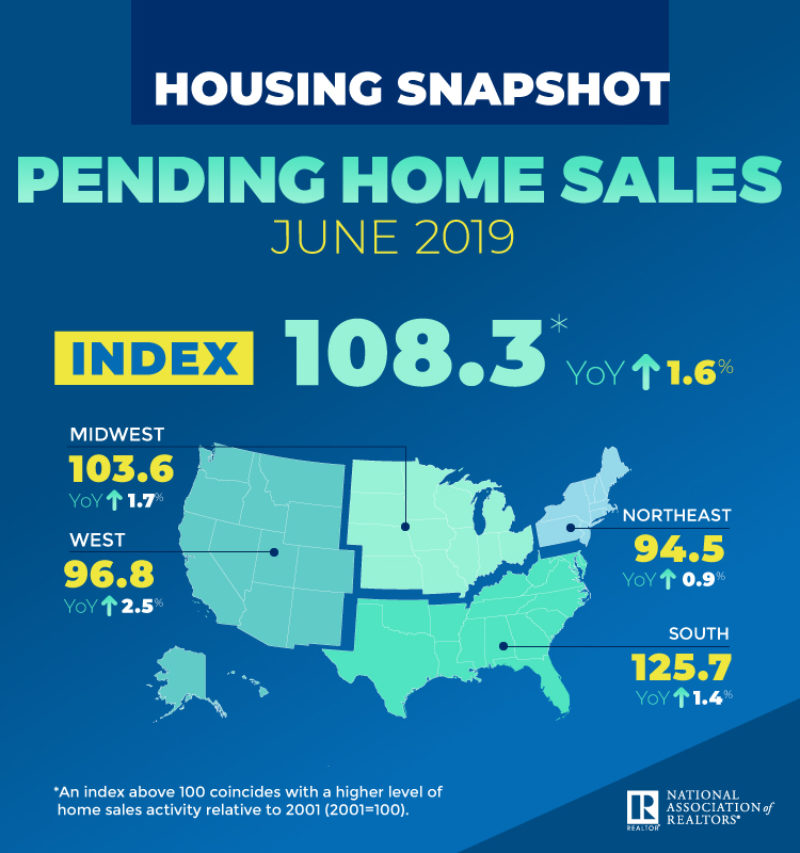
PENDING HOME SALES, JUNE 2019
Pending home sales tell us how many homebuyers signed contracts to buy homes in a given month. This number tells us how many home sales there will be in coming months as those deals close. That means pending home sales are an important economic indicator.
Think of pending home sales as the real estate industry’s accounts receivable. Now for the numbers:
– June contract signings rose 2.8% from May 2019
– Signings rose 1.6% from June 2018, the first year-over-year increase in over a year
– The West and Midwest saw biggest rises in pending sales—up 5.4% and 3.3%, respectively

WHAT DO PENDING HOME SALES MEAN FOR ME?
Pending home sales tell you where the housing market will likely be in the next two months. If homebuyers sign a lot of contracts in June 2019, those sales will close in July and August 2019.
If a month has an increase in signings, that’s good news for sales numbers in the following months.
So if people start to talk about a housing slump, tell ’em the numbers don’t back that up.
S&P CASE-SHILLER HOME PRICE INDEX, MAY 2019
Next up is data on home values from S&P, a huge data provider. According to the Case-Shiller index, home prices increased by 4.3% in May 2019.
That’s a very slight slowdown from April’s 3.5% gain, but home values are still increasing, which is good for sellers.
There’s good news for buyers here, too. Some overly-expensive housing markets are correcting their prices. Corrections bring the overall home price growth number down but gives buyers in those markets breathing room.
For example, Seattle saw home values shoot up in recent years as Amazon and other tech companies got big in the city. In May 2019, Seattle’s Case-Shiller Index fell 1.2% from May 2018, so there’s signs of hope for buyers in expensive markets, too.
KEY TAKEAWAYS
The headline numbers for both pending home sales and Case-Shiller show strength in the real estate market. If you’re buying as an investment, there’s still growth in home values and a healthy appetite for sales.
If you’re buying and selling a place to live, the more important stuff is on your home turf. Your local market will always have nuances that don’t show up in the big picture readings.
Your local lenders and real estate pros will know how to navigate your local market, and with their expertise and this data you’ll know the environment in which you’re making your real estate decisions.
More on how to use data to make your life choices below.
___
REFERENCE:
– Looking For Housing Deals? Then Look Beyond Case Shiller Price Data.
– Case Shiller Confirms Importance Of LOCAL Home Price Analysis
– Annual Home Price Gains Dip To 3.4% According To S&P CoreLogic Case-Shiller Index (S&P)
– Pending Home Sales Climb 2.8% in June (NAR)