Simultaneous Bottom For Rates & Home Prices? (charts)
In a market report last quarter, we buried a quotation that’s worth revisiting. It was from investment luminary Dean Witter in May 1933, about 3.5 years after the Great Depression began. He said:
“Some people say they want to wait for a clearer view of the future. But when the future is clear, the present bargains will have vanished. In fact, does anyone think that today’s prices will prevail once full confidence has been restored?”
These words have particular relevance for homebuyers and owners today, about 3.25 years after home prices began crashing and eventually led to what many economists have called the Great Recession.
The scale of this recession has been great indeed. Consumer and business confidence has been rattled to the core, which has led to negative GDP growth every quarter since 3Q2008 and a 9.8% unemployment rate (as of this October 5 writing).
But the latest S&P Case Shiller home price data through July shows that the decline in U.S. home prices has decreased for the past six months. At the same time, home loan rates are also at record lows.
It’s impossible to predict the bottom of any market, but these home price and rate data suggest we may be as close to the bottoms of rate and housing markets as we can be at the same time.
Why Mortgage Rates May Not Go Lower
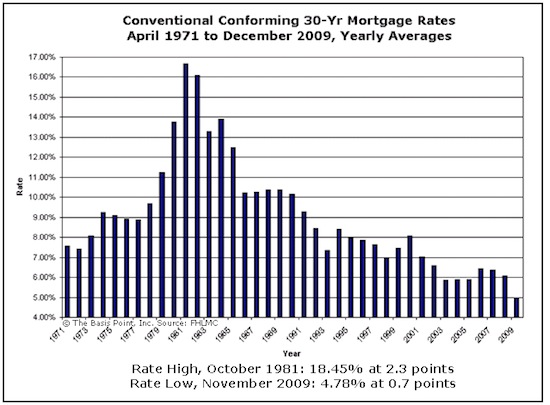
The chart below of conventional conforming 30-year fixed rates from 1971 to 2009 paints a clear picture of how rates have behaved through full market cycles over the last 38 years. [note: we updated chart on 12/4/09]
These are relevant years too because it wasn’t until October 1979 that the Fed began the process it still uses today of fixing the money supply and letting rates float. At the time it was done as a way to fight the 10.75% inflation that year (compared to 0.4% now), and the result was an unprecedented rate spike. In October 1981, a borrower had to pay 2.3 points to buy their rate down to 18.45%.
We’ve been nowhere near those levels since, and the reason we’re at record lows now is because of a Fed decision to buy mortgage bonds throughout 2009. The effect of this buying has been to push mortgage bond prices higher which pushes yields (or rates) lower.
Last month they announced that their $1.25 trillion bond buying budget wouldn’t increase but they’d extend their buying from December 31, 2009 to March 31, 2010. They’ve already spent about $960 billion to get rates to current levels, and now they have about $290b left to make it through March.
Extending the timeline without extending the budget means the Fed’s average weekly mortgage bond buying won’t be as effective in keeping rates low. It also reminds private holders of mortgage bonds that it may be time to trim positions and take profit before the Fed is done with their budget. When mortgage bond prices decrease in selloffs, rates rise, and this is the probable scenario between now and March 2010—and beyond.
Six Months Of Home Price Improvement
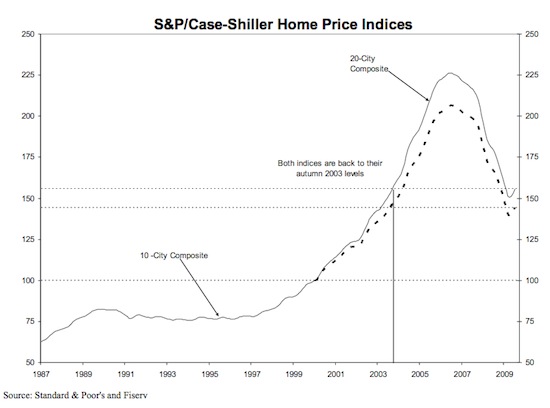
The chart below of home prices from 1987 to present shows that, although still negative (-13.3% year-over-year through July), the annual rate of decline of prices has improved every month for six months through July.
The S&P Case Shiller home price index measures prices across 20 major U.S. metropolitan areas, and is widely regarded as the most credible national home price data. The latest month’s data show that all 20 metro areas also showed an improvement in the annual rates of decline.
A word on reading this chart: it shows an ‘index’ level rather than actual value, and the indices have a base value of 100 in January 2000. So for example, the dotted line represents the 20-city index, currently at 144, which translates into a 44% appreciation rate since January 2000 for a typical single family home in the 20-city index.
Two Contexts For Investment Decisions
No investment decision is easy, and this is especially true when all market participants are still shaky from a few stormy years. Witter’s comments are worth consideration now because they were spoken at a time when the market situation was resoundingly similar.
Presenting home price and rate data against the backdrop of these comments doesn’t set out a formula for homebuyers to buy or owners to refinance. Those decisions require specific context: each individual’s or family’s objectives, budget and transactional costs. But what this data does do is provide much needed market context to combine with your objectives.


