Rates Up .375% Since January 15. Here’s Why It May Get Worse.
My friend Adam Quinones on the Reuters MBS team is all over the techs as the rate market is shifting higher. Below are his pre-Fed-meeting comments and charts of two critical rate market benchmarks: the 10yr Note and the Fannie Mae 30yr 3% coupon. The former is a guide for the latter, which is a guide for mortgage rates.
In English, he’s saying that rates could rise more than the .375% they’ve already risen since January 15. I issued a wake up call about higher rates back then. If you hit snooze, this is round two…
[UPDATE 1/30, 7:35 am PT: Rates are a bit worse again today as selling continues in the two key benchmarks discussed below (FNMA 30yr 3% coupon at 102-31 and 10yr Note at 2.0208). Technical support levels for both benchmarks are now breached and selling may continue—rates rise when bond prices drop in a selloff. This morning’s economic data is offsetting: the ADP jobs report at +192k new jobs beat forecasts of 165k (report/charts), while the first of three reads on 4Q2012 GDP at -0.1% lagged forecasts of 1.1% (report/tables). The offset can sometimes lead to a neutral market, but bond technicals are overpowering economic fundamentals for now. Rate spike continues.]
MBS/Treasury Market Wrap 1/29/13
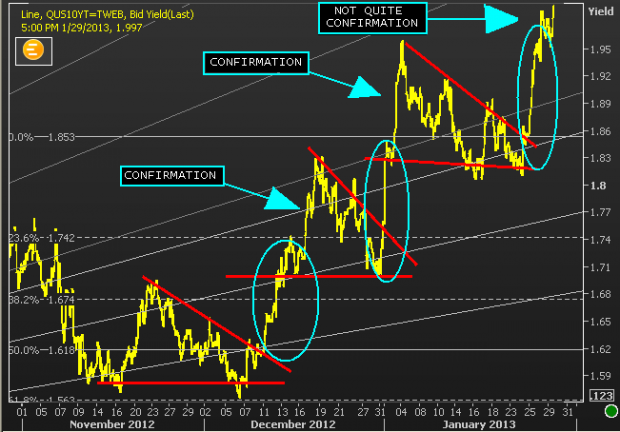
The rates community is teetering on a duration ledge. We’ve witnessed the technical release of stored energy but the bear flag pattern has yet to completely confirm a third consecutive breakout (see below). Instead selling stopped-out just as benchmark 10s breached the 2% threshold. This happened in high-volume; indicating a collective call for clearer guidance. Qualitatively, it’s a spot where market makers require concrete proof of sustainable economic/financial growth. Is this another economic false start or a real recovery? Quantitatively speaking, although a new handle doesn’t depict definite DV01 danger, it does send a shiver through shock models. This is what matters most. Because, if we do go over the “ledge”, snowballing will soon follow (where 2.10? 2.20?). Pipeline hedgers would watch as the TBA coupon stack decompressed and BestEx jumped from 3s to 3.5s (2-15 spread). We’re all getting antsy. The Fed speaks tomorrow and NFP prints on Friday morning. Both events carry weight. The potential for knee-jerk reactions remains high. If you haven’t been hedging I hope micromanaging pull-through is your preferred protection approach. Or playing the lottery…
Unfriendly Patterns. This chart is noisy but hopefully not loud enough to distract from the underlying intimation. Benchmark 10s are about to confirm a third consecutive bear flag pattern. We’re just waiting for 10s to move through ~2.05%. That would be a strong technical indication of more selling to come.
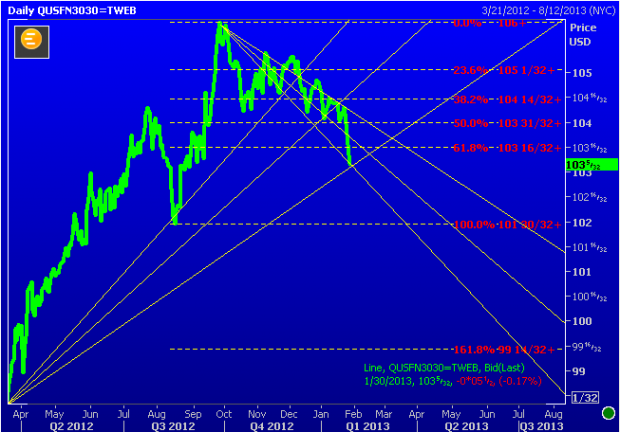
Also I updated my FNCL 3s chart to provide perspective on a longer timeline. Support fans now start from March 2012 TBA price lows and extend to record highs. Clearly we’re sitting on an important inflection. This is the duration ledge. Breaking though this support zone would verify a technical breakdown and indicate more selling ahead. It’s a big week. If this trend is to correct, it needs to happen soon…
___
Reference:
– Follow Adam on Twitter: @AQ_MND


