New Home Sales Down Month/Month. Prices and Year/Year Sales up.
Huge day of economic fundamentals. Here’s the rundown…
New Home Sales (February 2013)
– New Home Sales (seasonally adjusted, annualized) were 411,000 in February
– January was revised from 437,000 to 431,000
– Sales were up 12.3% year/year
– The fact that New Home Sales fell is dismissed in most media accounts
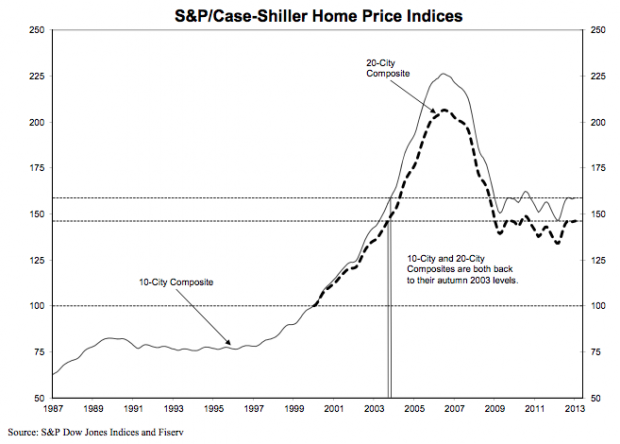
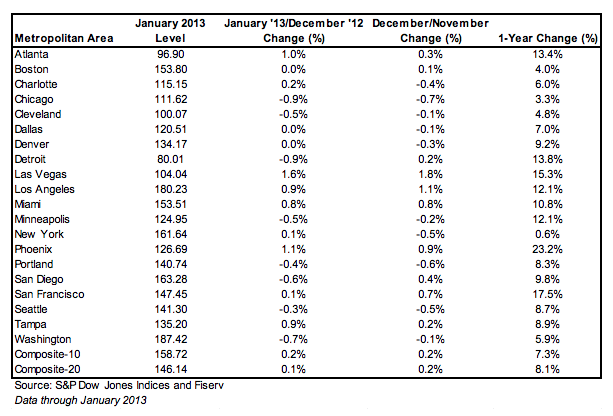
S&P Case-Shiller Home Price Index (January 2013)
– 20-city, Seasonally Adjusted Month/Month +1.0%
– 20-city, Not Seasonally Adjusted Month/Month +0.1%
– 20-city, Not Seasonally Adjusted Year/Year +8.1%
– Full report and chart/table below.
– Also don’t miss: Trulia Chief Economist Explains Which Home Price Reports Matter
– As I commented a few days ago this picture could change. Prices had been driven up due to lack of supply and last week’s data showed increased supply and fewer purchase applications. We may be about to see slower increases in prices as supply increases. Supply had been suppressed because so many potential sellers were underwater. The number of folks underwater has decreased.
Chain Store Sales (week ended 3/23/2013)
– ICSC-Goldman Store Sales Week/Week -1.7%. Previous was +1.4%.
– ICSC-Goldman Store Sales Year/Year +1.0%. Previous was +2.3%
– Redbook Store Sales Year/Year +2.6%, Previous was +2.9%.
– Consumer Metrics Institute Absolute Demand Index for on-line shopping has been slightly down for the past 6 days. Together these reports show very modest increases in consumer spending which is the largest component of GDP.
Durable Goods Orders (February 2013)
– New Orders Month/Month +5.7%. Previous was -3.8%
– Ex-transportation Month/Month -0.5%. Previous was +2.9%.
Consumer Confidence (March 2013)
-Consumer Confidence fell from 69.6 to 59.7.
– This is a survey index which issupposed to measure consumer’s predisposition to spend. This supports the somewhat weak Chain Store Sales reports.
Richmond Federal Reserve Indices (March 2013)
– Manufacturing Index is +3. Previous was +6.
– Service Index is +4 down from +11.
– Growth is there but at a smaller level.


