Home Construction, Jobless Claims Down: Details & Charts
Lots of economic data today. Below are quick comments and charts on housing starts (construction), building permits, jobless claims, consumer inflation, manufacturing.
Jobless Claims
-352,000 for week ended January 14, seasonally adjusted
-Down 50,000 from previous week’s 402,000 (was 399k)
-4-week moving average was 379,000, down 3,500
-Biggest weekly drop since September 24, 2005
-Lowest jobless claims since April 2008
-But job market still not adding jobs fast enough
–More analysis/charts from Bespoke
Housing Starts & Building Permits (December 2011)
Housing Starts (December)
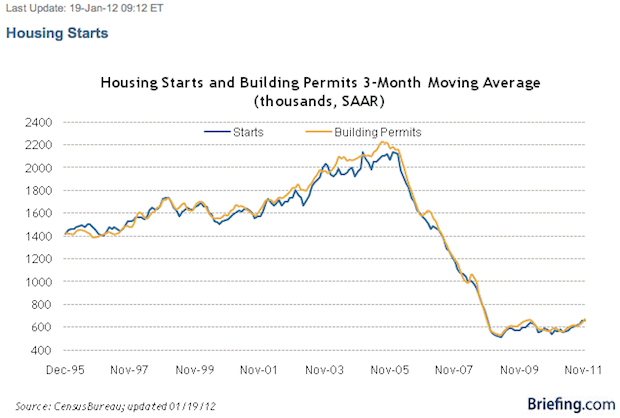
-Housing Starts 657k seasonally adjusted, annualized. Below previous (685k) & consensus (678k)
-Construction (measured by Starts) down 4.1% in December
-Single family starts up from 450k to 470k, highest since April 2010 when homebuyer tax credit boosted production
-Multifamily home constructions down from 13% from 215k (Nov) to 187k (Dec)
-Single family starts ended 2011 at 428,600, worst year on record.
Building Permits (November)
-Building Permits 679,000, seasonally adjusted, annualized
-Permits are a measure of future construction
-Up 0.1% from November
-Flat month
There should be 1,500,000 annual Housing Starts to keep pace with population growth and scrappage. Relaxed mortgage underwriting led to increased supply and the recession has created more supply (foreclosures) and lower demand leading to still decreasing home prices. The housing market is not going to return to normal until the foreclosure inventory is cleared and values stop falling.
-Starts/permits releases: Commerce Dept | NAHB
-Table and chart below. Click images for more.
CPI: Consumer Inflation (December 2011)
-CPI, Month/Month unchanged from previous month
-CPI, Year/Year change +3.0%
-CPI core (less food & energy) Month/Month change, +0.1%. Previous +0.2%. Consensus +0.1%.
-CPI core (less food & energy) Year/Year change, +2.2%
-Consumer inflation is flat, and not a threat near-term
Philadelphia Fed Manufacturing (January 2012)
-Index of manufacturing activity in Philly region rose to 7.3 for January
-Region is: Eastern Pennsylvania, Southern New Jersey, Deleware
-This is down from a from a revised 6.8 in December (was 10.3)
-Zero is the dividing line between expansion and contraction
-Fourth straight monthly gain even with revision down for December
–Full report
by Dick Lepre & Julian Hebron

