Who Are the 1%?
This week I read an article by Mike Tanner of the Cato Institute seeking to answer the question “Who are the 1%?”
Making no judgment about OWS I do believe that it is interesting to determine if we can profile the top 1% of income earners. Knowing who these people are or more precisely how they make their money might help with determining fiscal policy or, more precisely, whether it is beneficial to increase income tax rates on these folks.
I want to thank Mike’s research assistant Charles Hughes for pointing me to this paper.
The authors are Jon Bakija, Professor of Economic at Williams College, Adam Cole, Office of Tax Analysis, U.S. Treasury Department and Bradley T. Heim, School of Public and Environmental Affairs, Indiana University.
The paper is written in the language of the technical side of economics with little slant to left or right.
Let me start with a couple of disclaimers: (1) the paper was written in November 2010, (2) it went directly to part of the IRS called SOI (Statistics of Income) division to get the data for the research. The most recent year for which data was available was 2005. This was near the peak of the bubble. We will look at who the 1% were in 2005 and make some suggestions as to how the bubble collapse affected some subsets of those 1%.
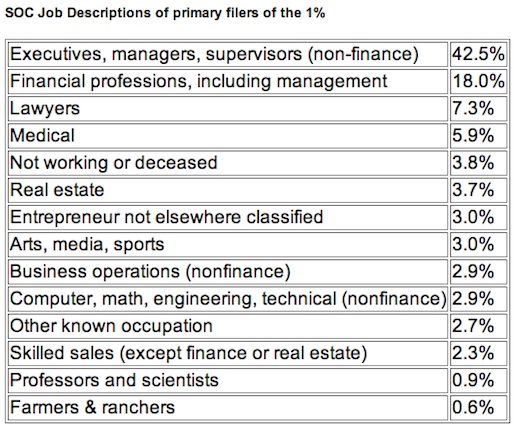
These industry grouping come from the SOC (Standard Occupational Classification) coding used by Federal statistical agencies to classify workers into occupational categories for the purpose of collecting, calculating, or disseminating data.
This paper uses the following definition of income:
Income = Adjusted Gross Income – social security income – unemployment income – state tax refunds
The only comment I will make is that this shows that almost 42.5% of the 1%’ers are the owners and managers of non-financial businesses. These people are not Wall Street. These are people who work and own, manage or supervise the businesses that are the heart of the U.S. economy.
I will offer the opinion that since the collapse of the real estate bubble there has been a decrease in the percent of 1%ERs in financial professions and real estate.
The paper also seeks to answer the question: Why has the gap in income increased so much since 1979. There is no easy answer.
The authors suggest several hypotheses to explain the significant increase in income disparity:
-advancing globalization. Some high income people can sell their skills and the skills of their companies to a larger set of customers.
-technology has made the salaries of highly-skilled workers much more valuable than the salaries of low-skilled workers.
-there are more “superstars” creating larger income gaps between those at the top and those not at the top. This is more obvious for people in entertainment and sports.
-executive compensation has changed giving, for example, stock options to executives.
-social norms had changed reducing outrage regarding high salaries.
-the Tax Reform Act of 1986 lowered the top rate for individual income taxes minimizing the incentive to form C-corporations and migrating some income onto personal tax returns from S-corporations.
They also mention income elasticity. This means at least two things: lower tax rates provide incentive to earn more because you get to keep more. This is also true at the opposite end of the income picture. Folks who benefit from food stamps, unemployment and Medicaid may have diminished reasons for increasing their income because they will lose some benefits. The issue of income elasticity is so intertwined with social issues that it becomes nearly impossible to discuss it in only economic terms.

