Here’s Why Rates Are So Damn Low
Rates are holding record lows as mortgage bonds (MBS) rally ever higher. Rates drop when bond prices rise, and the bid on the FNMA 3.5 coupon—a key benchmark lenders use to price rates—has been relentless. It’s at a staggering 104.13 as of now.
If you look at the most recent U.S. jobs and manufacturing data summarized below as well as better retail earnings this morning (WSJ, IBD), it’s a picture of modest improvement. Normally this would mean higher rates as investors shift out of safe bets into riskier assets. But the overhang of the Eurozone debt crisis proves to be too much.
It doesn’t help that Bernanke implied the U.S. could be Greece in his testimony this morning. Read the link for why it’s really not, but that doesn’t matter on short-term sentiment. The bond rally continues on this, and of course the week’s hot Eurozone topic: Greece, which is still trying to get private investors to agree on a debt deal.
The deal calls for Greek bond investors to exchange outstanding bonds for new ones with coupons as low as 3.6-3.75%, and take losses of about 70% in the process. If most private investors don’t agree, it could trigger credit default swaps (CDS) on these securities, leading a European bank liquidity issue, which is really a global issue.
That plus the fact that the deal may not save Greece is why investors are seeking refuge in MBS and Treasuries (which are yielding 1.84 right now, also staggeringly low).
And now for the stat/chart rundown…
Jobless Claims
-367,000 for week ended January 28, seasonally adjusted
-Down 12,000 from previous week’s revised 379,000 (was 377k)
-4-week moving average was 375,750, down 2,000
-The 4-week average translates into 1,637,000 Jobless Claims/month
-While this week’s data is modestly better, this is not an indication of a healthy jobs market. It is healthier that it was but still not well. Tomorrow’s BLS Employment Situation Report will give another look.
Challenger Job-Cut Report
-Announced layoffs for January were 53,486 up from previous month’s 41,785
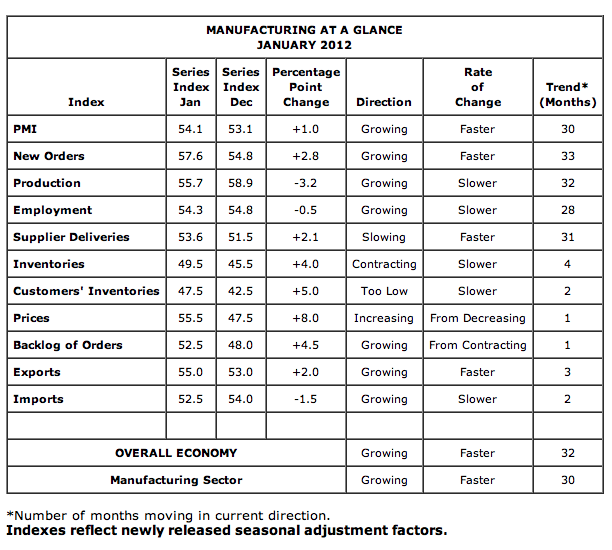
ISM Manufacturing Index (January 2012)
-ISM Manufacturing Index 54.1. Previous was 53.9.
-50 is dividing line between expansion and contraction
-This is the 30th straight month of (albeit modest) expansion
-The data are consistent. The wholesale part of the economy seems unaware that consumer spending had flattened. Either Consumer Spending will increase or manufacturing will decrease. The last GDP report showed significant growth in inventories.
The point is that this is perilous for 1Q2012 GDP. If Consumer Spending is flat and Government Spending is down and the Investment part of GDPis down because inventories are too large then GDP will be flat or even negative.
Here’s a summary of all ISM Manufacturing trends:
Worker Productivity and Costs (4thQ2011)
-Nonfarm productivity – Quarter/Quarter change +0.7%
-Unit labor costs – Quarter/Quarter change (seasonally adjusted, annualized) – +1.2%
-Productivity growth slowed (it was +2.3% in the previous Q/Q comparison) while compensation rose 1.9% after falling 0.3% in 3rdQ2011.
ADP January 2010 Jobs Report
-ADP showed +170,000 new private jobs
-Previous was +325,000, Consensus was +172,000
-These are private sector jobs only: +170,000 private jobs is not an indication of economic growth and just barely keeps pace with population growth.
Mortgage Applications Week Ended January 27
-Purchase Index, Week/Week -1.7%
-Refinance Index, Week/Week -3.6%
-Composite Index, Week/Week -2.9%
– Purchase Index, 4-week Moving Average +4.11%
– Refinance Index, 4-week Moving Average +4.22%
– Composite Index, 4-week Moving Average -2.9%
Construction Spending (December 2011)
-Construction Spending, Month/Month +1.5%
-Construction Spending, Year/Year +4.3%
-New single-family construction was 1.5%
by Julian Hebron & Dick Lepre

