
Fundamentals 7/12: Chain Store Sales, Trade Deficit Up
Retail Sales
-ICSC-Goldman Store Sales Week/Week: +0.4%
-ICSC-Goldman Store Sales Year/Year: +5.5%
-Redbook Store Sales Year/Year: 5.4%
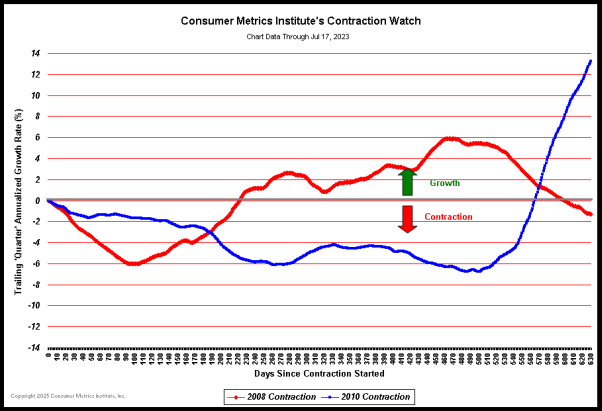
Consumer Metrics Index of Online Retail Sales: “We are becoming more convinced with each passing week that the rate of contraction of on-line consumer demand for discretionary durable goods “bottomed” at the end of May 2011. The climb in the year-over-year contraction rate since then has been significant.”
This is a graph of what Consumer Metrics charts. This measures online shopping. The blue line is the current contraction which started on January 15, 2010. The red line is the post-Lehman contraction.
Trade Deficit
The Trade Deficit for May was sharply higher at $50.2 billion.
The economy is driven by consumer spending and these measures of Retail Sales are positive. The Trade data makes one ask just how much of of the increases in consumer spending were of domestic goods.
Keep in mind that GDP = C+I+G+(X-M) where C=Consumer Spending, I=Investments, G=Government Spending, and (X-M) is the Trade Deficit. Today we have hints about C and X-M. We will start to see the net effect when we see 2Q2011 GDP.