Fundamentals 7/15: Consumer Mood, Manufacturing, Inflation
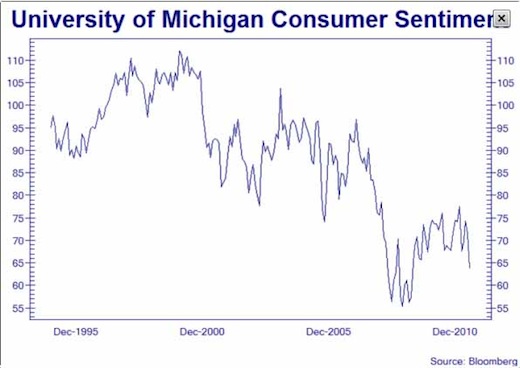
Consumer Sentiment
–July sentiment 63.8, down from 71.5 in June
-Lowest since March 2009

June Consumer Inflation
-CPI Overall Month/Month: -0.2%
-CPI Core (less food & energy) Month/Month: 0.3%
-CPI Overall Year/Year: 3.6%
-CPI Core (less food & energy) Year/Year: 1.6%
-Today’s full report
-Same story we already know: Core inflation is tame.
-Overall gets smacked around by increases in food and energy prices.
-Higher food & energy prices largely from QE causing lower dollar, higher commodities
-Hidden in the CPI data is the fact that owner-equivalent rent was up +0.2%.
-Rents are increasing as the homeownership rate declines.
Manufacturing
–July Empire State Manufacturing -3.8 vs. -7.8 for June
-Empire State Index in 2nd month of contraction. Readings above zero signal expansion.
-Industrial Production Month/Month: +0.2%
-Industrial Production Year/Year: +3.4%
-Capacity Utilization Rate – 76.7%
-Details in the Federal Reserve Report G.17
Money Supply
As a key to understand what QE did to Money Supply take a look at Federal Reserve report H.3. Excess banking reserves this week were $1.634 trillion. Last November they were $972 billion. That extra $662 billion is not dead money. It is there available for the holders these liability accounts to deploy. Enticing them to deploy it necessitates increasing consumer and investor confidence.
