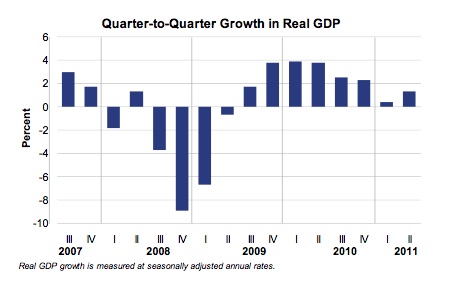
Fundamentals 7/29: Awful GDP Trend

GDP
-2Q2011 GDP at +1.3% vs. 0.4% for 1Q2010 (revised down from 1.9%)
-This 1st of three readings worse than low expectations
-Second revision August 26
–Full report here.
-In light of fiscal and monetary policy, this report is dismal
-The heart of this report is this sentence:
“Real personal consumption expenditures increased 0.1 percent in the second quarter, compared with an increase of 2.1 percent in the first.” Then there is this sentence about government spending, “Real federal government consumption expenditures and gross investment increased 2.2 percent in the second quarter, in contrast to a decrease of 9.4 percent in the first.”
A bit of good news is that final sales of domestic products increased 1.1% (annualized) in the quarter as contrasted to dead flat in the first quarter.
It may sound a bit extreme but I believe that the methodologies which BEA uses to produce the GDP report are suspect. What I mean is simply, “Why are they still adjusting GDP data from 2008?” We may be better served by being presented with the raw unadjusted data.
In any case the message remains the same: the consumer drives the economy and the consumer is unhappy, concerned about employment and overleverged. Not exactly motivation to run out and shop for anything other than antidepressants.
Interestingly, if we realize that the Consumer Metrics raw and near live index of online discrationary spending started a dramatic increase up last month we might think that 3Q2011 will see a jump in GDP. This assumes that the consumer does not get discouraged.
It is the consumer who will drive recovery. Expensive government fiscal policy and inflationary government monetary policy may be doing more harm then good.
Keep in mind that GDP = C (Consumer spending) +I (Investments) +G (Government Spending) +Exposrt – Imports. Later today or by tomorrow morning we will present a detailed breakdown of the various components.
Employment Cost Index
-ECI 2Q2011 change 0.7% vs 0.6% in 1Q2011
-ECI Year/Year change 2.2%
-Cost increases due mostly to benefit costs
-Most business expenses are from employment costs
-Higher costs impact earnings, but ECI trends have been steady to lower
–Full report
July Consumer Sentiment
-Sentiment Index: 63.7, prior was 63.8
-The report covers how consumers view their personal finances as well as business and buying conditions
-The index averaged 89 in five years leading to start of December 2007 recession
July Chicago PMI
-Business Barometer Index: 58.8
-Index measures manufacturing activity in Chicago region
-This is down but still indicative of growth
–Full report
