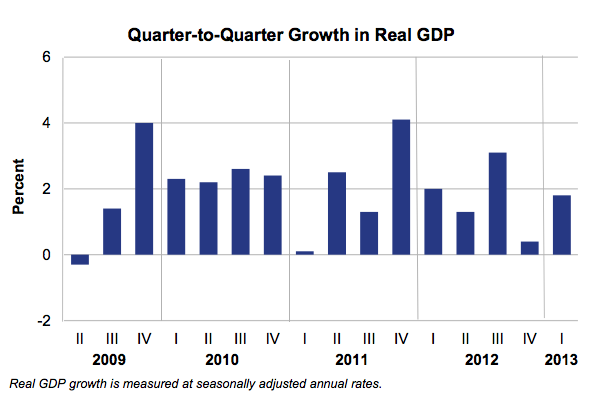
GDP Revised Down, QE Hope Revised Up
GDP (1Q2013)
– Real GDP Quarter/Quarter 1.8%. Previous estimate was +2.38%
– GDP deflator Quarter/Quarter 1.2%. Previous estimate was +1.1%. This is an inflation gauge where components are weighted according to their share of GDP.
– This is the third of three 1Q3013 GDP reports. This is the second time that 1Q2013 GDP has been revised downward. If we are almost 4 years into recovery, GDP growth at this level is poor. We have had massive deficit spending by Washington and monetary policy as expansive as conceivable. The underlying fact is this: the damages done by the borrowed money bubble associated with the “let’s loan money to anyone” policy of the prior decade take a very long time to recover from.
– Real per capita disposable incomes took yet another hit. The annualized contraction of real per capita disposable income has now reached -9.21%, dwarfing the worst reading of the Great Recession. Someone needs to be paying attention to this.
– Flatter GDP created some hope that QE will continue for longer than was thought last week and may have induced some Treasury and MBS buying today, which won’t reverse the recent rate spike, but gives it pause at least for now.
Corporate Profits (1stQ2013)
– After-tax Profits Year/Year +4.7%.
– After-tax Profits Quarter/Quarter -5.3% (annualized)
MBA Mortgage Applications (week ended 6/21/2013)
– Purchase Index Week/Week +2.0%. Previous weeks were -3.0%, +5.0%, -2.0%, 3.0%, -3.0%.
– Refinance Index Week/Week -5.0%. Previous weeks were -3.0%, +5.0%, -15%, -12.0%.
– Composite Index Week/Week -3.0%. Previous weeks were +3.3%, +5.0%, -11.5%, -8.8%, -9.8%.
– The good news is that higher rates have, as of yet, had little impact on purchase volume.

