Headline Trading: 2011 Theme Slogs Into 2012
Mixed economic data since yesterday. Data summaries and comments on each report below.
Stocks are up on the week (S&P 500 now at 1303) on better-but-still-weak homebuilder confidence (below), better Goldman Sachs earnings, and optimism that Greece will reach a debt deal with private investors as talks resume today.
Mortgage bonds—namely the 3.5% coupon most lenders use to price rates—are slightly off nosebleed levels, down 11 basis points to 103.02 as MBS investors try to hold line in this headline driven market. Rates rise when mortgage bonds sell, but we’d need this selloff to expand 10 or more basis before lenders hike rates.
This Greek debt talks will be the first big test to see if 2012 will officially continue the same slog we saw throughout 2011 with stocks rallying (and bonds selling) on the least bit of good U.S. economic data and/or optimism on EU debt crisis resolution, then reversing. The definition of a passed test is if there’s a definitive agreement on who will take (and commit to) losses.
Stay tuned, and here’s your data and chart rundown…
PPI: Wholesale Inflation (December 2011)
-PPI, Month/Month change -0.1%
-PPI, Year/Year change +4.8%
-Core PPI (less food & energy), Month/Month change +0.3%
-Core PPI (less food & energy), Year/Year change +3.0%
-The overall data shows that food and energy prices have been volatile. From a macroeconomic point-of-view core is more important and core, while a bit too high for the present state of the economy (and versus expectations of 0.1% monthly), is fairly tame. Mortgages selling a bit this morning on the news, which will push rates up if it holds.
MBA Mortgage Applications (week ended 1/13/2012)
-Purchase Index, Week/Week Change +10.3%
-Refinance Index, Week/Week Change +26.4%
-Composite Index, Week/Week Change +23.1%
-The gigantic gain is a data fabrication due to the fact that the previous week contained New Year’s Day.
National Assn of Homebuilders (NAHB) Confidence Index (January 2012)
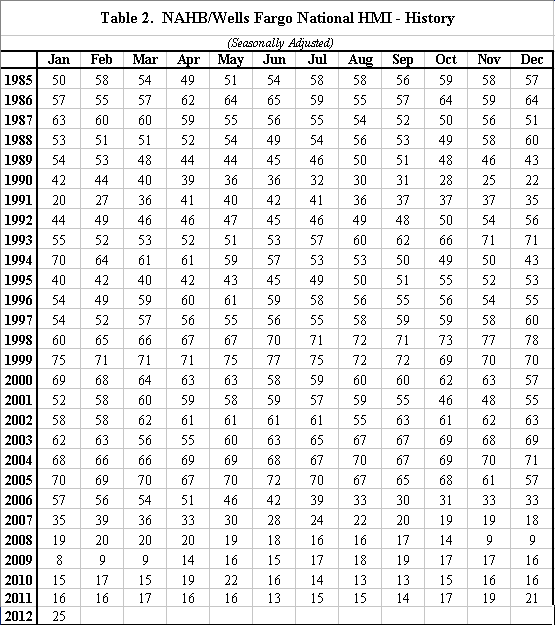
-Homebuilder Confidence Index value was 25. Previous was 21.
-4 straight monthly gain, highest since June 2007
-But still way off from 50+ that’s considered to be a healthy market
-Last 50+ reading was April 2006
-Here’s a table showing builder confidence from 1985-PRESENT
Industrial Production/Capacity Utilization (December 2011)
-This is a measure of the strength of the manufacturing sector
-Industrial Production, Month/Month +0.4%
-Manufacturing, Month/Month +0.9%
-Capacity Utilization Rate 78.1%
-The manufacturing sector has been growing for about two years.
-The gain in Industrial Production for December was after a November loss.
Retail Chain Store Reports (week ended 1/14/2012)
-Redbook Year/Year +2.8%. Previous was +3.3%.
-ICSC-Goldman Store Sales, Week/Week +0.1%. Previous was -5.4%
-ICSC-Goldman Store Sales, Year/Year +3.0%. Previous was +2.8%
-Post-Christmas retail sales have been slow.
Empire State Manufacturing Survey
-NOTE: this was released Tuesday 1/17
-Index of business conditions in NY region rose to 13.48 for January, from 9.53 in December
-Zero is the dividing line between expansion and contraction
-This is the third consecutive monthly gain
-Highest level since hitting 11.88 in May 2011 then plummeting to -7.79 in June 2011
–Full report
by Dick Lepre & Julian Hebron

