
Housing Is Worse Than You Think. Or Not.
Media outlets are great at getting you to click on housing doom headlines. But some underlying stories, like this NYT piece, actually present data well despite the headline. Here are two critical notes to consider before reading it:
First, high-rate driven home price declines will give back some but likely not all gains during the pandemic. This means long-time homeowners are fine, and low-down-payment pandemic era homebuyers going underwater will be limited.
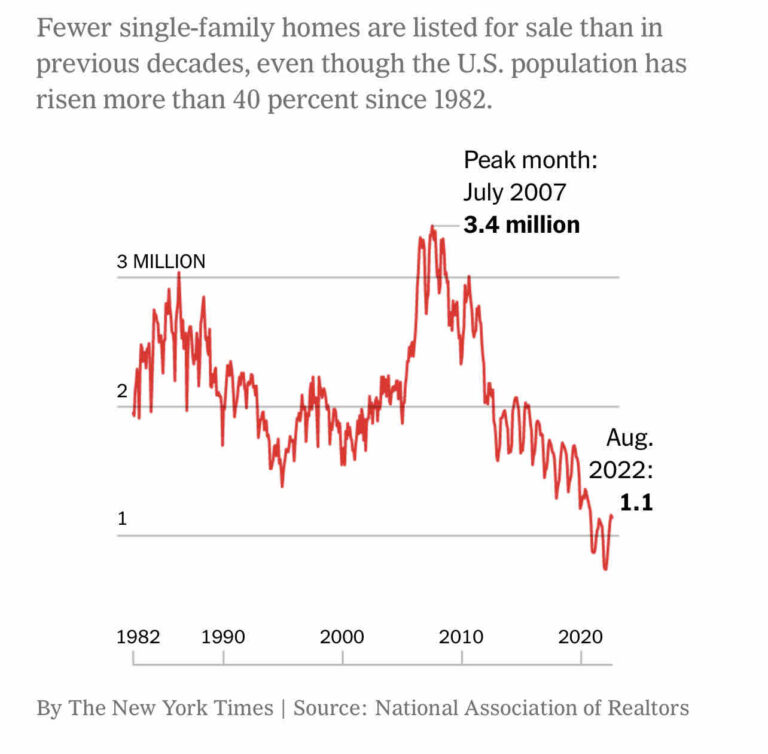
Second, most media will keep ringing alarm bells about rising housing inventory as clickbait. But isn’t rising inventory a buyer’s market signal after years of sellers being in control? And in a long-term context, is today’s growing housing inventory enough to cause collapse-level price declines? The inventory chart above suggests otherwise.
Buyers need some relief and they’ll get it in this cycle. First in the form of more inventory, then in lower prices, and eventually in lower rates. But when that third phase of lower rates hits around 3Q23 and 4Q23, home price relief for buyers will wane. So there’s a sweet spot in each local market, and finding that sweet spot is your goal that transcends all doom scrolling.
Justifiably, buyers and sellers are in wait-and-see mode as the worst of the Fed’s aggressive rate policy hits mortgage rates. But the most aggressive rate policy may be behind us, and most local markets will settle into new, lower price levels during the next 3-12 months. This is when smart deals get made — for buyers and sellers.
Every city, neighborhood, and street is different, so you must watch it closely. Headlines won’t give you neighborhood-level price trends you need to make smart decisions. Your local lender and realtor are better equipped to help with that.
___
Reference:
– The Housing Market Is Worse Than You Think (NYT)