June Economic Fundamentals Roundup
Below is a a roundup of all key U.S. economic fundamentals from June 4-22. Regular readers know these are daily, but that was on pause during my break. These are the basics that inform daily rate market decisions and commentary, so they may be too dry for many. But still noting them here for my own reference. Thanks to my colleague Dick Lepre for helping me stay up to speed.
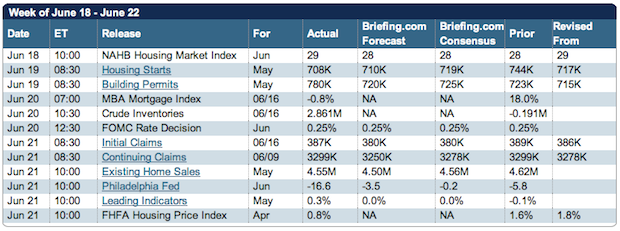
FUNDAMENTALS JUNE 18-22
Greek Elections
The election in Greece only avoided default. The amount of work which must be done to fix the fiscal solutions of the countries in the EU and preserve the EU is enormous. This is a problem which will stretch on for several more years. Having a single monetary system and different fiscal systems may be the root of the problem.
National Association of Homebuilders Confidence Index (June 2012)
– National Association of Homebuilders June index is 29, same as May
– Highest since May 2007 and retains up trend after dropping to 24 in April
– Still way off from 50+ considered to be healthy market
– 50 is dividing line between positive and negative sentiment
– Last 50+ reading was April 2006
– Full June 2012 report
– Here’s a table showing builder confidence from 1985-PRESENT
MBA Mortgage Applications (week ended 6/15)
– Purchase Index, Week/Week -9.0%
– Refinance Index, Week/Week 1.0%
– Composite Index, Week/Week -0.8%
– The Purchase Index may have been affected by the fact that the previous week was bloated because it followed Memorial Day. No matter, this data is not positive.
FOMC
The FOMC meeting this week played like this. I think Congress perhaps erred by giving the Fed the major role in banking regulation. Granted, it was by default because most every other agency failed to stop all that led to the mortgage/liquidity mess. The Fed’s role should be to regulate money supply. This paper from the Richmond Fed discusses the pros and cons of regulatory consolidation.
Initial Jobless Claims (week ended 6/16)
– Initial Claims 387,000
– 4-week Moving Average 386,250
– The folks who make up, I mean, report this data continue to revise the prior week upward making the new data always better that the prior. This week the prior was revised to 389,000. It has become impossible to disguise the fact that the job market is very weak.
NAR Existing Home Sales (May 2012)
– Existing Home Sales – 4,550,000 Seasonally Adjusted Annualized Rate.
– Month/Month -1.5%
– Year/Year +9.6%
– The fact that we have record low mortgage rates and lower prices asn still home sales declining is related to the jobs market, difficulty in mortgage qualifying and the fact that there are a lot of folks locked into their underwater homes.
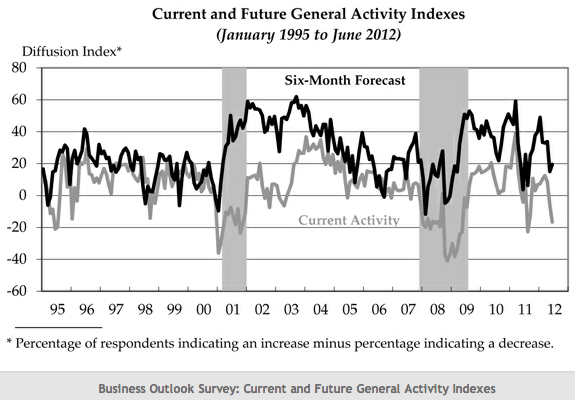
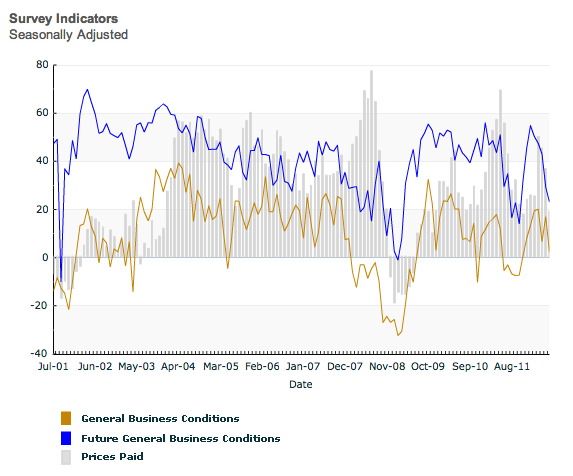
Philadelphia Fed Manufacturing (June 2012)
– General Business Conditions Index -16.6
– Sharp drop from -5.8 in May, which was a sharp drop from +8.5 in April
– May was first negative in 8 months, and now it’s negative two straight months
– Zero is the dividing line between expansion and contraction
– This measures manufacturing activity in Eastern Pennsylvania, Southern New Jersey, Delaware
– Bespoke said this could be an early sign of recession
– Full report and chart below
FHFA Home Price Index (April 2012)
– Month/Month change +0.8%
– This number is only for home with FNMA or FHLMC financing
– It does not include distressed property sold for cash
Housing Starts (May 2012)
– Starts (Seasonally Adjusted Annualized Rate) 708k. Previous 717k revised to 744k.
– Permits (Seasonally Adjusted Annualized Rate) 780k. Previous 715k revised to 723k.
– Housing Starts are less than half of what is needed to keep pace with population growth.
– Here are the main reasons Housing Starts are so low: Employment insecurity, absence of belief that housing is a great investment, difficulties in qualifying for a mortgage, lack of mobility of prople tied down by an underwater home, supply created by foreclosure not building
Retail (week ended 6/16/2012)
– ICSC-Goldman Store Sales, Week/Week Unchanged
– ICSC-Goldman Store Sales, Year/Year +3.6%
– Redbook Store Sales Year/Year +2.4%
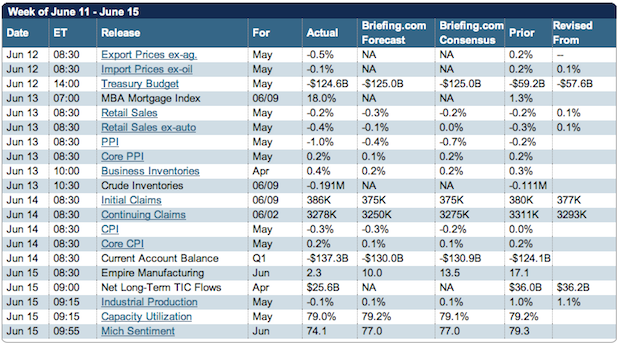
U.S. ECONOMIC FUNDAMENTALS JUNE 11-15
Import and Export Prices (May 2012)
– Export Prices, Month/Month change -0.4 %
– Export Prices, Year/Year change -0.1 %
– Import Prices, Month/Month change -1.0 %
– Import Prices, Year/Year change -0.3 %
MBA Mortgage Applications (week ended 6/8/2012)
– Composite Index, Week/week +18.0%
– Purchase Index, Week/week +19.0%
– Refinance Index, Week/week +13.0%
– Before you conclude that we are in a massive housing recovery, note that the basis for comparison (the previous week) included the Memorial Day holiday
Retail Sales (May 2012)
– Retail Sales, Month/Month -0.2%
– Retail Sales less autos, Month/Month -0.4%
– Less Autos & Gas, Month/Month -0.1%
– Keep in mind that Retail Sales data is not inflation adjusted making it worse than useless by sometimes conveying the wrong direction of movement for the “C” (Consumer Spending) portion of GDP.
Retail Week Ended 6/9
– ICSC-Goldman Store Sales, Week/Week change -0.7%. Previous was +0.4%
– ICSC-Goldman Store Sales, Year/Year 2.9%. Previous was 2.8%.
– Redbook Store Sales, Year/Year change +2.0%. Previous was +3.1%.
Business Inflation (May 2012)
– PPI Core (less food & energy), Month/Month 0.2%
– PPI Core (less food & energy), Year/Year 2.8%
– PPI Overall, Month/Month -1.0%
– PPI Overall, Year/Year 0.8%
– While the overall index is important to the individual, it is core which filters out the rather hefty short-term swings in energy and food prices and presents a better macroeconomic picture. Given the dismal state of economic growth, +2.8% year/year is a bit large.
Business Inventories (April 2012)
– This is the “I” portion of GDP = C+I+G+(X-M)
– Inventories for April were +0.4%.
– Lurking behind all of the mediocre or worse fundamentals is the massive uncertainty of the financial situation in Europe. Nothing good is going to happen and it is going to take a long time for it not to happen.
NFIB Small Business Optimism Index (May 2012)
– Level was 94.4. Previous was 94.5
Initial Jobless Claims (week ended 6/9/2012)
– New Claims 386,000. Previous revised from 377,000 to 380,000
– 4-week Moving Average 382,000.
– The jobs market remains ill.
Consumer Inflation (May 2012)
– CPI core (less food & energy), Month/Month 0.2%
– CPI core (less food & energy), Year/Year 2.3%
– CPI overall, Month/Month -0.3%
– CPI overall, Year/Year 1.7%
– This data mimics PPI of yesterday (below) showing overall dropping due to lower energy prices and core CPI lower that core PPI and just inside the comfort zone.
Consumer Sentiment (June 2012)
– Sentiment Index Level = 74.1
– Previous was 79.3
– This is a survey index allegedly measuring consumers predisposition to spend.
Industrial Production (May 2012)
– Production, Month/Month -0.1%
– Capacity Utilization Rate 79.0%. Previous was 79.2%
– Manufacturing has plateaued having recovered from the dip which started in 2008.
Empire State Manufacturing (June 2012)
– General Business Conditions Index Level 2.29
– Any positive number indicates expansion
– This is down sharply from previous month’s 17.09
U.S. ECONOMIC FUNDAMENTALS JUNE 4-8
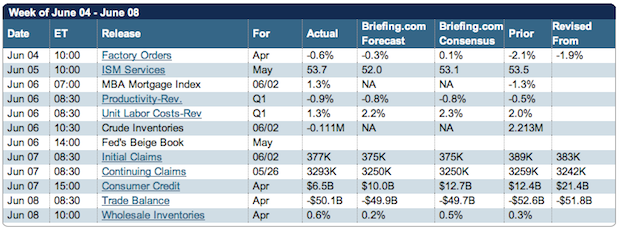
Factory Orders (April 2012)
– Month/Month -0.6%. This is after a decline of 1.5% for March.
-Weak fundamentals and especially last week’s weak revised GDP and very weak BLS Jobs Report have brought into the light just how weak the economy has been. GDP growth has been under 3% for 7 consecutive quarters despite Keynesian fiscal solutions and extremely accommodative monetary policy.
ISM Non-Manufacturing (May 2012)
– Composite Index – 53.7. Previous was 53.5.
– March was 58.8.
– Anything over 50 indicates growth.
Mortgage Applications
– Purchase Index, Week/Week -1.8%
– Refinance Index, Week/Week 2.0%
– Composite Index, Week/Week 1.3%
– Disappointing numbers especially with new record lows this week
Productivity and Costs
– Nonfarm Worker Productivity (GDP/hours worked), Quarter/Quarter -0.9%
– Unit labor costs, Quarter/Quarter +1.3%
– This compares 1Q2012 to 4Q2011
– Decrease in productivity is a disappointment indicative of slow GDP growth in 1Q2012
– Think about these two points: (1) job growth is puny, and (2) the people who are working are getting less GDP produced/hour. Then do the math.
Retail Week Ended 6/2
– ICSC-Goldman Store Sales Week/Week +0.4%. Previous was -0.5%.
– ICSC-Goldman Store Sales Year/Year +2.8%. Previous was +2.9%.
– Redbook Store Sales Year/Year +3.1%. Previous was +3.2%.
Jobless Claims (week ended 6/2/2012)
– Initial claims 377,000. Previous week was revised upward from 383,000 to 389,000
– 4-week Moving Average 377,750.
– The jobs market is better than it was two years ago but considering the amount of deficit spending and mega-accomodative monetary policy from the Fed, the results remain puny.
Trade Deficit (April 2012)
– Trade Balance for April was -$50.1 billion. Previous (revised) was -$52.6 billion.
– This is the (eXports-iMports) component of GDP.
– Lower trade deficit translates into benefit for GDP.

