
Of these 20 major U.S. cities, where are 2023 home prices down most so far?
Today, one of Wall Street’s preferred home price measures showed December-to-January home prices dropped in 19 of 20 cities it measures. S&P CoreLogic Case Shiller January home prices fell 0.5% nationally, and the image above shows how much 19 of 20 key cities — actually major metro areas — fell. Here are some key notes home buyers and owners need to know about this report, including its backward looking nature.
– From January 2022 to January 2023, U.S. home prices were up 3.8%.
– This is up less than the 5.6% home prices gained from December 2021 to December 2022.
– So the pace of home price increases is declining.
– And when housing cools like this, it’s important to look at monthly figures.
– From December to January, U.S. home prices were down 0.5%.
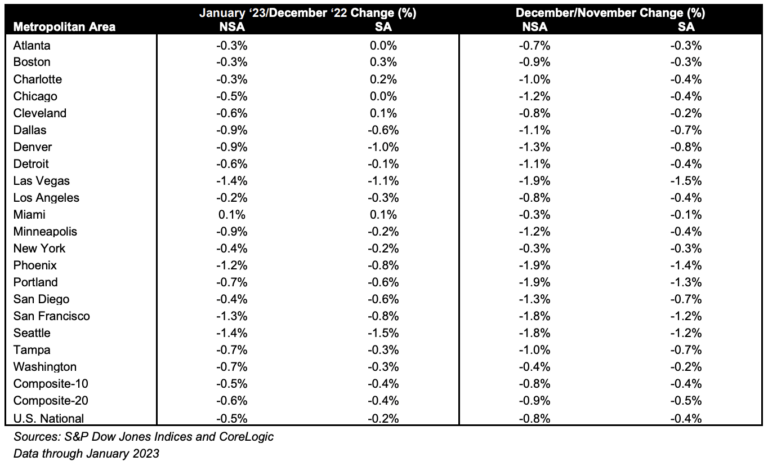
– The table above shows December to January home prices fell in 19 of 20 major cities* this report measures.
– The biggest December to January declines were in Seattle (-1.4%), Las Vegas (-1.4%), and San Francisco (-1.3%).
– There was a tiny December to January gain in only one city: Miami (+0.1%).
– Wait, it’s almost April, do January home prices even matter?
– The S&P CoreLogic Case Shiller report is highly credible, but it is on a 3-4 month lag.
– Why? Because it takes 30-60 days to close home purchase deals, then they hit public record, and that’s what Case Shiller mines for prices.
– So January’s closed sales are largely reflecting market activity from November and December.
– Also, again, these aren’t cities as much as broad regional areas.
– Example: “San Francisco” — where prices are down the past 2 months and also down 7.6% for the year through January — isn’t just the city. It’s a broad 5-county Bay Area region (see methodology link below).
– As such, you can’t price a home using data like this.
– Homebuyers using Case Shiller to price a home is like investors using a stock index or even sector data to price a stock.
– It’s one input, but local analysis is more important for property selection and offer price strategy.
– To make responsible home buying (and selling) decisions, you need current and truly local price data.
– You do this by looking at home prices at the neighborhood, street, and individual property level with a realtor.
– Realtors help buyers do this for free because sellers, not buyers, pay realtors in most markets.
– Here’s how much new and existing homes cost right now in America.
– The median price for existing homes, which are now 88% of all sales, is currently $363,000.
– The median price for newly built homes, which are now 12% of all sales, is currently $438,200.
– Can you afford this? Links below explain affordability math lenders use on these prices.
Please comment or reach out with any questions.
___
Reference:
– REPORT: Case Shiller Home Prices Declined Again in January
– Home prices rise to $363k after sales snap 12mo losing streak. Is this affordable?
– Newly built home prices $438,200 in March 2023. Can you afford this?
– S&P CoreLogic Case Shiller home price methodology
– Case Shiller home prices are now owned by CoreLogic, a major housing data player. They’re now making mortgage software moves too, as detailed here: Housing data giant CoreLogic buys mortgage fintech Roostify: what’s in it for lenders & consumers?
– * NSA and SA mean not seasonally adjusted and seasonally adjusted. This post is discussing the NSA figures.