Rent vs. Buy: The Most Important Housing Decision Of All Time
As a preview to today’s November Case Shiller home price report, I said yesterday that the two most important considerations for home buyers are debt to income ratio and price vs. rent. To recap, homebuyers first must understand their affordability using a debt-to-income ratio, then they can evaluate their housing options in their local market by comparing cost to rent vs. buy.
Today I’m going into more detail on both.
BASICS OF COMPARING YOUR DEBT TO YOUR INCOME
Debt-to-income analysis is critical because it tells you what percentage of your income you’re going to spend on housing and all other monthly obligations. This is how all U.S. mortgage lenders make loan approval decisions. There two other quantitative measures lenders use for loan decisions—credit scores and the percentage of the home’s value that will be financed (aka loan-to-value ratio)—but the debt-to-income ratio is by far the most important because it looks at the most data.
To calculate it, you divide debt by income to get a percentage. Sounds simple, but it’s all about how much debt and income are actually being included in the analysis.
The debt side captures your required housing and non-housing monthly debt payments. For housing that means highest-case principal and interest on a mortgage payment and property taxes (before tax deductions), homeowners insurance, and mortgage insurance if applicable. For non-housing it means payments on present and future student loans, credit cards, car loans/leases (the present versions of these items come from credit reports) plus child support, alimony, and countless other types of non-housing debt people have hidden in their credit reports, tax returns, and asset account statements.
There are also countless variations for calculating the income side of the ratio. For a standard W2 type employee, income is defined as gross base income plus a 24-month average of commissions and bonuses minus any unreimbursed expenses claimed on tax returns. If you’re self-employed (as a sole proprietor or a 20%+ owner of a company) the calculation uses net income after you deduct expenses on your tax returns. Whether W2 or self-employed, you can count dividend and interest income, but if you’re using the assets that generated that income for down payment, the income must be reduced commensurately.
So what percentage do you want when you divide your debt by income?
Lenders allow you to spend 40-50% of your income on your debt obligations depending on the loan size and type. But due to the grey area in debt and income calculations noted above, each person’s final decision of what they can afford should be based on their own budget tolerance rather than what lenders allow.
Put another way: lenders will often let you go up higher than you may want to go.
A more appropriate cap to use as a rough guideline is spending 37% or less of your income on all your debts.
You’ll want to go even lower if you think primary residence tax deductions may go away in the future, you or your spouse may choose (or be forced) not to work and/or earn less in the future, or anything else that will decrease your income and/or increase your debts.
BASICS OF COMPARING RENTING VS. OWNING COSTS
Now that you know how to evaluate how much housing you can afford, the next step is to understand whether it’s cheaper to rent or buy. Like debt-to-income, it’s all about what numbers you’re looking at.
This rent vs. buy topic is obviously a more highly discussed topic than debt-to-income, and as such, there’s huge variation on rent vs. buy math floating out there. The reason is because people use national figures for home prices and rents.
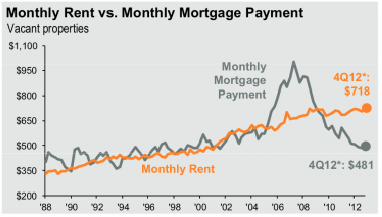
For example, here’s a JP Morgan chart making the rounds this month showing how it’s cheaper to rent than buy nationally.
Awesome right? But here’s the fine print: the monthly mortgage payment assumes a 20% down payment at prevailing 30-year-fixed-rate mortgage rates. Their analysis is based on median national asking prices for rents and median mortgage payments based on national listing prices.
This is of questionable relevance for two reasons:
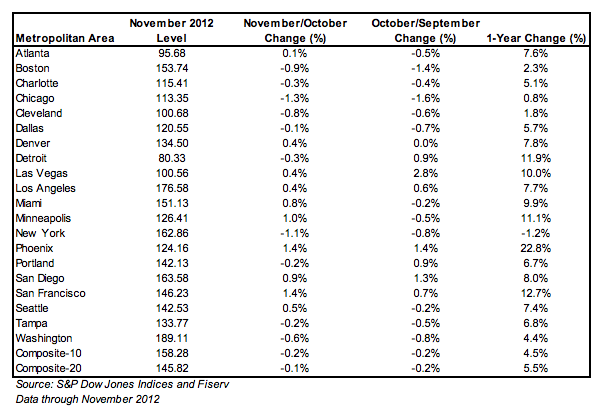
(1) Home prices and rents vary wildly across the U.S., not just from city to city, but from neighborhood to neighborhood, and even street to street. For example, look at the table below from the Case Shiller November home price report released today. National year-over-year home prices were up 5.5% through November whereas ‘San Francisco’ was up 12.7%. And Case Shiller defines ‘San Francisco’ not as the city but rather as a broad 5 county Bay Area region where prices are all over the map. And this is to say nothing of the fact that this Case Shiller data represents what the market looked like 5-6 months ago rather than today. You have to look at current hyperlocal market home price and rental data to make decisions (here’s how).
(2) The JP Morgan chart doesn’t cover tax considerations or full housing cost. At least according to the chart’s footnotes (which I noted above), JP Morgan isn’t using full mortgage plus property taxes plus insurance. They’re also not accounting for the fact that, at least presently, mortgage interest and property taxes are deductible.
So let me try to clear all this up with a real world example:
Couple in wants to buy a single family home in San Francisco for $850,000 with enough down (26.41%) to get to a $625,500 loan (this is the conforming loan cap for Bay Area).
Their debt-to-income ratio would be as follows:
Total housing cost = $3838 (2852.50 mortgage, 100 insurance, 885.42 taxes)
Total non-housing debt = $30 (credit card)
Income = $11481.33
Debt To Income Ratio = 33.69% (3868/11481.33)
Based on the discussion above, this ratio is low enough for them to make the case that they can afford the home. So the next step is to compare this monthly housing cost to their existing rent.
They rent (an albeit lower quality, smaller) existing home for $3200.
So the simple math says it’s $638 cheaper to rent than buy.
But this is before housing tax deductions.
If you multiply their estimated annual mortgage interest ($22,674) and property tax ($10,625) paid by an estimated tax bracket of 33%, you get an estimated annual tax savings of $10,989 after deductions. Expressed as a monthly, this number is $916.
Subtract this from the gross and their net after tax housing cost is $2922, which is less than their rent.
This type of ‘cheaper to own’ result was elusive in a high priced market like San Francisco until around November 2011 when rents started rising faster. Now it’s more common.
Of course one can argue the calculation is too generous because it gives credit for the mortgage interest deduction which may be reduced or eliminated.
But the point is: this is how you do the basic rent vs. buy calculations on the ground.
It’s a lot more specific and more useful for making decisions than the macro rent vs. buy stats and stories that litter mainstream media.
Then the next step is comparing how the down payment cash may otherwise perform if invested differently … but that’s a post for another day.
___
Reference:
– This Economist Table Shows It’s Cheaper To Buy Than Rent In U.S.
– Robert Shiller: Housing Optimism Way Too Premature (Henry Blodget interview on BI)
– Today’s release of Case Shiller November home prices
– How To Price A Home Locally (Hint: Ignore Case Shiller Data)
___
About today’s headline: It’s inspired by this morning’s tweet exchange below. I was amused seeing how BusinessInsider editor Joe Weisenthal, who’s known for exaggerated headlines (but great posts), seemed so bored by today’s Case Shiller home prices. Then Guardian economics editor Heidi Moore called him out on an outsized headline used to preview this week. It was awesome. Both of them are heavyweights and must-follows on Twitter: @moorehn, @thestalwart
@thebasispoint @thestalwart hey, what happened to the THE MOST IMPORTANT WEEK EVER FOR THE GLOBAL ECONOMY?
— Heidi N. Moore (@moorehn) January 29, 2013
No content on this site is a recommendation. See the site’s Terms Of Use for a full disclaimer.
$XHB, $ITB, $KBH, $RYL, $LEN, $TOL, $PHM


