San Francisco House Prices (and how much house you get) vs. U.S. Average for 3Q18

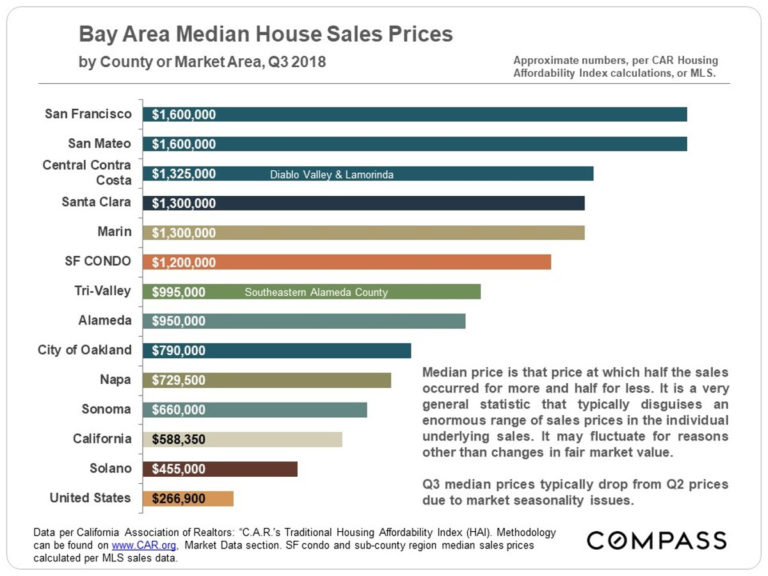
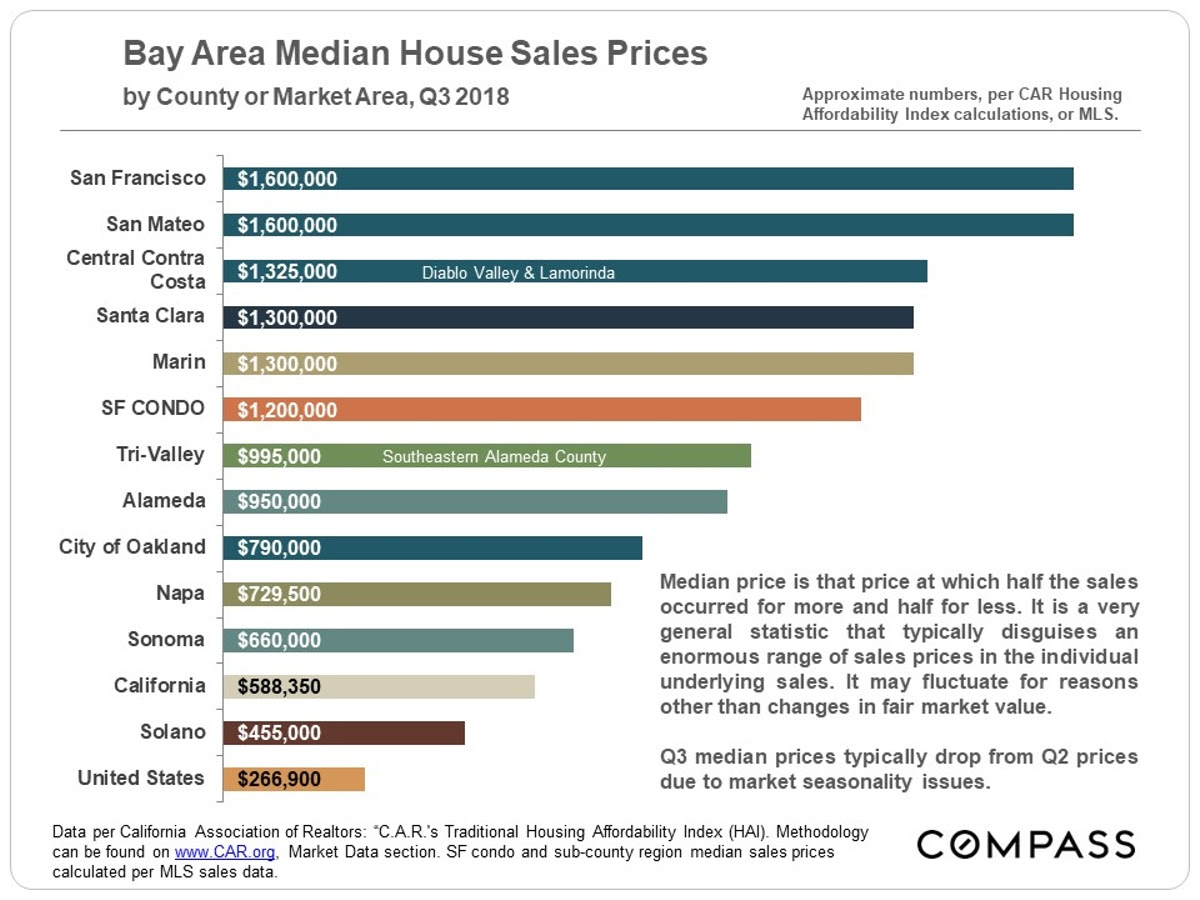
Here are two Bay Area housing charts from my friend Patrick Carlisle, chief market analyst at Compass. The first one is house prices through 3Q18 in various Bay Area cities and regions plus California and all of U.S. (condo prices for San Francisco are separate bar on the chart at $1.2m median!). The second one is how much house those median prices get you in those Bay Area regions. For those of you outside the Bay Area, this is a good comparison to see how far your money goes.


