Affordability Tips For Homebuyers As New Home Prices Peak At $493,000


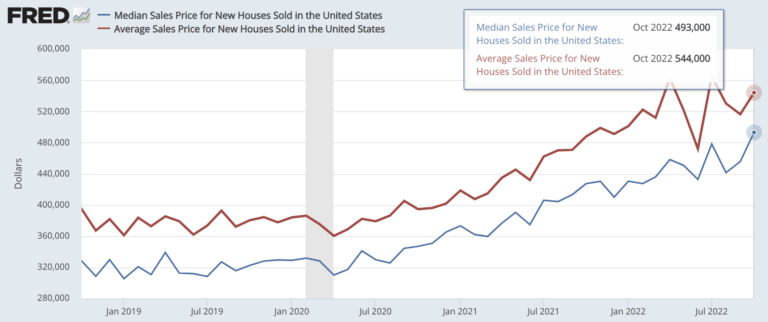
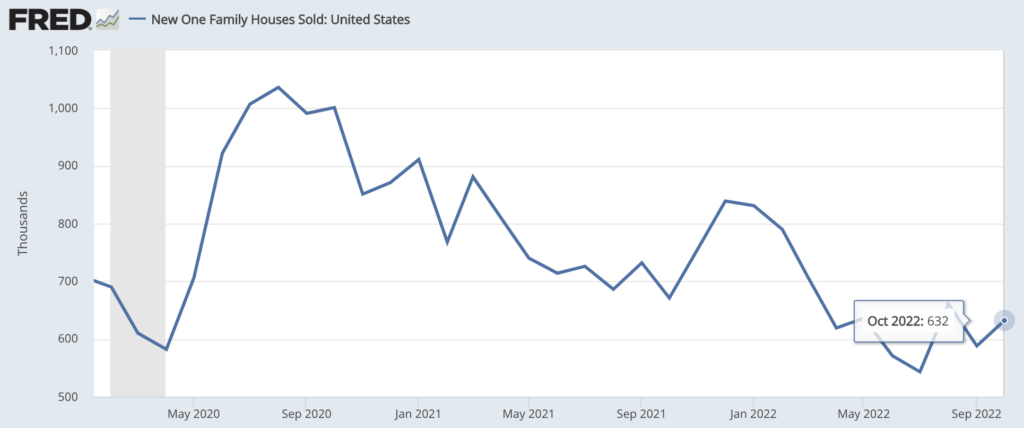
The latest Census/HUD report shows 632,000 new homes sold in October, up 7.5% from September’s 588,000 units sold, and median new home prices rose to a new peak of $493,000 (blue line in first chart above). The National Association of Homebuilders (NAHB) suggests two reasons for this:
1. Low inventory of existing homes.
2. Builders used incentives to attract new buyers.
Negotiating New Home Prices With Builders
Builder incentives can include free or discounted upgrades, closing credits to help lower mortgage rates, or simply lowering new home prices.
Clearly, builders aren’t broadly lowering prices just yet, which is why October median and average new home prices rose to $493,000 and $544,000, respectively.
For comparison, median prices of existing homes for October were down to $379,100 from a June peak of $413,800.
People selling existing homes are more likely to negotiate on price because they are individuals. And because existing home sales have dropped nine straight months, so these sellers are nervous.
Conversely, builders are big entities, and will try to hold the line on new home prices by offering incentives other than price — like those noted above.
Buyer Ground Game vs. All These Stats
As for NAHB’s suggestion that low inventory of existing homes drives more new home sales, I’m not sure I agree — because there are more move-in-ready existing homes available right now.
NAHB notes only 63,000 units of new home inventory is built and ready to move in. Meanwhile, there were 1.22 million unsold existing homes listed for sale in October.
If you’re a buyer, this means you might be inclined to focus on a home you can move into now. And there are more existing homes to choose from.
Plus, it’s all about affordability, and a median price of $379,100 for an existing home is lower than median new home prices, which just peaked.
Final Affordability Notes For Homebuyers
– The NAR tracks existing home prices and sales, and they say median prices better represent the market than average prices because averages are skewed higher by a smaller share of very pricey sales.
– I put both median ($493,000) and average ($544,000) new home prices in the chart above so you can see both.
– The same is true of new home sales that fewer higher priced sales bring up the average.
– And here’s one more input (from NAHB) on new home prices: In October, there were 23,000 homes that were priced above $500,000.
– Either way, when you calculate home affordability the way lenders do, you might find affordability isn’t as elusive as headlines suggest.
– This is especially true since peak mortgage rates over 7% plummeted 0.5% to around 6.625% since inflation started cooling last month.
I’m putting links below with more on these topics.
Hit me with questions on new home prices and affordability.
And check back for a revised affordability post I’m putting up shortly.
___
Reference:
– Why New Home Sales Rose To 632k In October (NAHB)
– Sales of existing homes dropped 9th straight month in Oct. Prices down to $379,100.
– Mortgage rates plummet as inflation cools
– How to calculate home affordability yourself
