
CHART: Core Inflation 1993 to 2024 Shows Why Fed Won’t Cut Yet
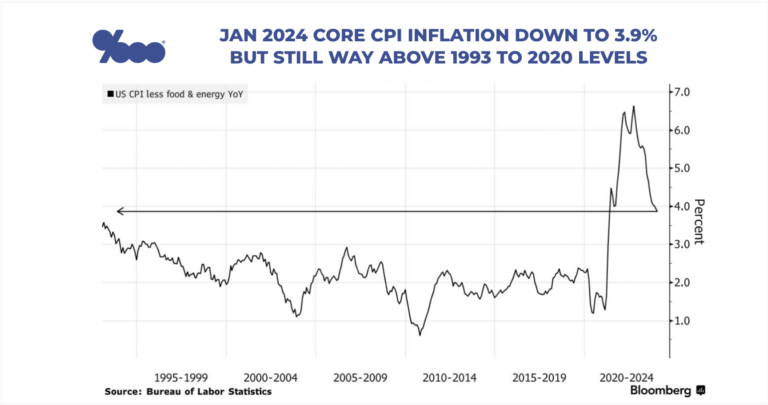
Check out this Bloomberg chart of Core CPI inflation from 1993 to 2024. This is why the Fed is holding the line on rate cuts.
On the one hand, January Core CPI is down to 3.9% from a September 2022 peak of 6.6%.
On the other hand, you can see very clearly Core CPI residing closer to the Fed’s 2% target from 1993 to 2020.
If there were one chart to explain why the Fed is holding the line on rate cuts, this is it.
Still, we’re likely to see this break lower in the coming months, and get cuts by the Fed’s May 1 or June 12 meetings.
___
Reference:
– Live: Analysis of US CPI Report for January