Everything you need to know about home prices and today’s avalanche of May 2019 housing data

Real estate nerds* are chattering about home prices and 3 huge estate data releases on out today and what it means for the economy. Here’s a cheat sheet so you can understand the big picture while you make your own financial decisions around real estate.
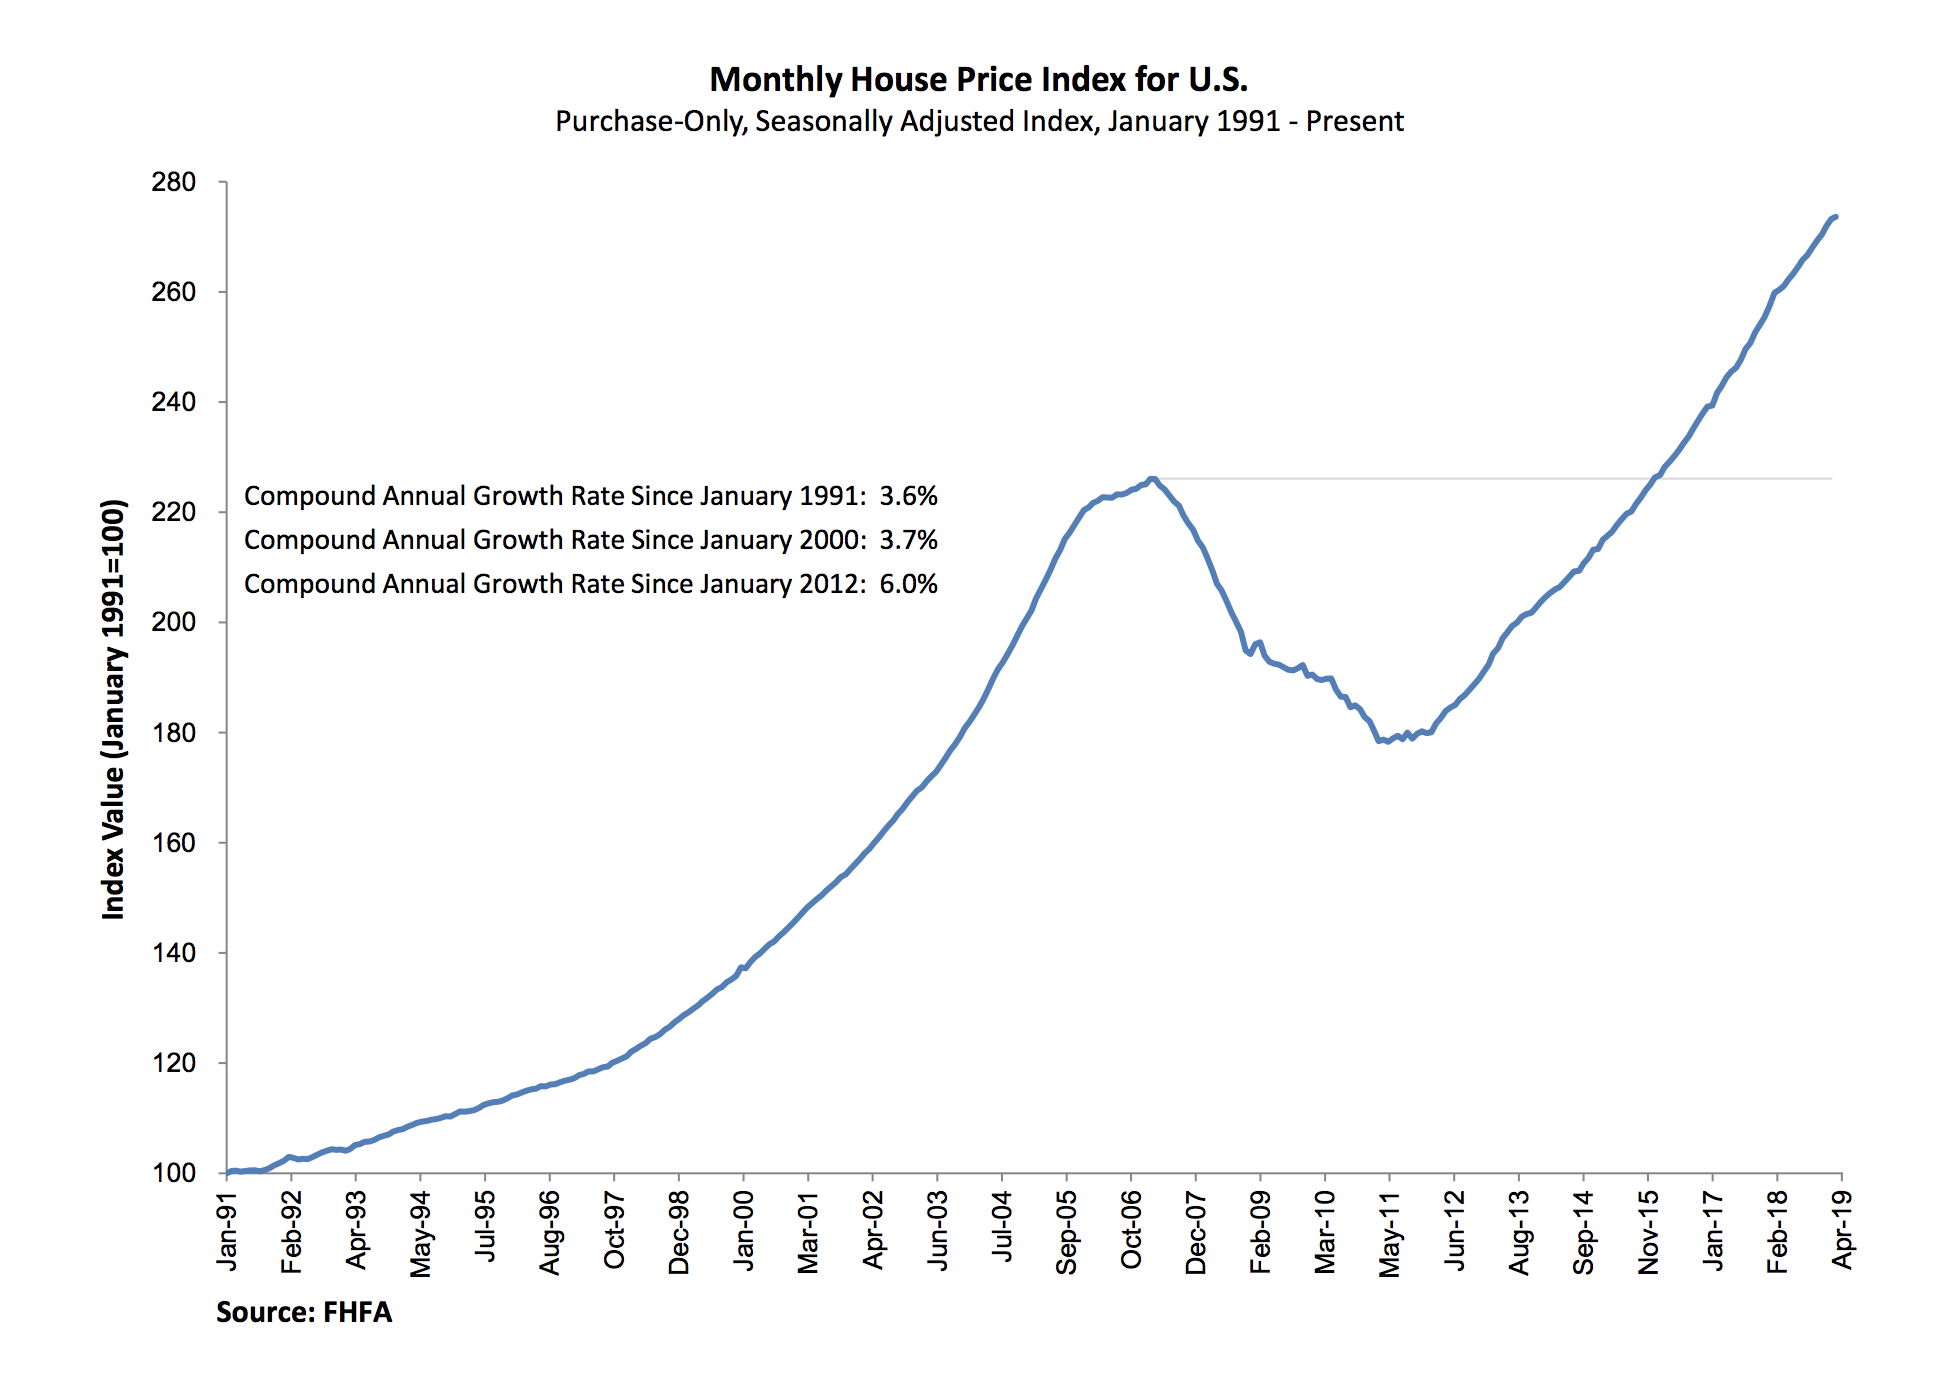
1. FHFA HOME PRICES (April 2019)
-Home prices rose 0.4% from March to April 2019
-Prices rose 5.2% from April 2018 to April 2019
-Year-over-year growth slowed—April 2017 to April 2018 home price growth was 6.8%
WHAT DO FHFA HOME PRICES MEAN FOR ME?
The Federal Housing Finance Agency is the regulator for Fannie Mae and Freddie Mac, which own or back most of the U.S. mortgage market, and they track the prices of properties with Fannie or Freddie-backed mortgages.
The break down their data regionally so this serves as a reasonable indicator of the home prices an average homebuyer might encounter.
Home price growth is good for sellers, and since wages have been growing somewhat in the past few years, that indicates a healthy economy with buyers who can continue to afford these homes. Home ownership gets less attainable when wages don’t grow alongside home prices.
+++
1. S&P CASE SHILLER HOME PRICES (April 2019)
-Home price growth slowed from 3.7% in March to 3.5% in April
-Seattle’s rapidly-growing market came down to Earth—home prices increased 13.1% from April 2017 to April 2018, but stayed flat from April 2018 to April 2019.
-Las Vegas, Phoenix and Tampa reported the highest year-over-year rise in home prices
-7.1% year-over-year price increase in Vegas, 6.0% increase in Phoenix, and 5.6% increase in Tampa
WHAT DO S&P CASE SHILLER HOME PRICES MEAN FOR ME?
AND HOW IS THIS DIFFERENT FROM FHFA HOME PRICES?
This can be a little confusing, but the two housing price indices serve different purposes.
The FHFA tries to calculate home price increases that the average homebuyer would encounter while searching for a home. It’s calculated by looking at prices of single family homes with Fannie and Freddie-backed mortgages when those homes are sold or the mortgages refinanced.
The S&P Case-Shiller Index is a longer-term tracker that’s more useful for economic wonks than the consumer. It takes a 3-month average of home prices in 20 key regions across the country instead of only looking at sales within a calendar month. Case-Shiller also focuses on existing (rather than new) single family homes like FHFA.
Case-Shiller weights its averages pretty rigorously to exclude home sales way outside market value of the home, flipped homes, and other weirdness. The 3-month averaging and weighting can explain why Case-Shiller’s home price index is less than FHFA’s.
The takeaway from comparing the two?
Home prices are still growing steadily, but big picture growth is slowing.
If wages can pick up, and new home construction stays healthy, we could be looking at a more affordable housing market.
Also, if you want to get the most out of this data, look at the numbers on your area. That will tell you way more about home prices than any national average.
Home buying and selling is hyper-local and prices are negotiated in real-time vs. these home prices measures which are backward looking.
+++
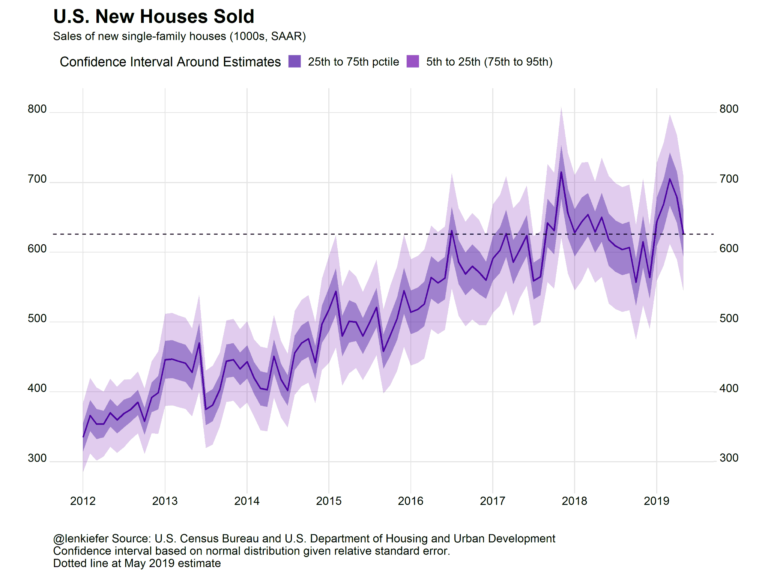
3. NEW HOME SALES (May 2019)
-629,000 sales of newly-built homes in May 2019
-7.8% down from April sales of 679,000
-3.7% down from May 2018 sales of 650,000
-Median sale price of new home: $308,000
-Average sale price of new home: $377,200
-333,000 new homes for sale , which represents 6.4 months of supply at current sales rate
WHAT DO NEW HOME SALES MEAN FOR ME?
New home sales are really important since they’re a forward-looking indicator.
That’s a fancy term for something you can base predictions on.
New home sales were down for the month of May and trending down year-over-year, which on its own could be bad news.
But build permits for new construction in May increased meaningfully, which shows us that homebuilders are confident if they build new homes, you’ll come and buy them.
+++
WHAT DOES ALL THIS DATA MEAN OVERALL?
Today’s housing data dump shows us the real estate market is still healthy enough to support rising home prices, but not on fire. If wages can keep growing and interest rates stay low, we could even see an increase in affordability.
We’ll keep an eye on all this home price data so you don’t have to.
For further reading, here’s some homework on how to go deeper on all this below, and a fun thread of visuals from our friend Len Kiefer, the chief economist at Freddie Mac.
new home sales down… pic.twitter.com/RWFclAdk1C
— Leonard Kiefer (@lenkiefer) June 25, 2019
___
Reference:
– House Hunting? Street Knowledge Beats Charts (The Basis Point)
– Why U.S. Housing Market May Be Healthier Than We Think (The Basis Point)
– Home buyers and sellers get good home sale news today (The Basis Point)
– Looking For Housing Deals? Then Look Beyond Case Shiller Price Data. (The Basis Point)
– *like me, I admit.

