Home prices affordable at $359k after sales fall 12th straight month

NAR’s January existing home sales showed sales down for the 12th straight month. That’ll dominate the headlines. But this 12-month trend has brought down existing home prices from their peak, which helps affordability. Here are a few key takeaways for home buyers, and a link to the report.
HOME SALES SUMMARY
– Annualized sales of existing (as opposed to newly built) homes was 4 million for January.
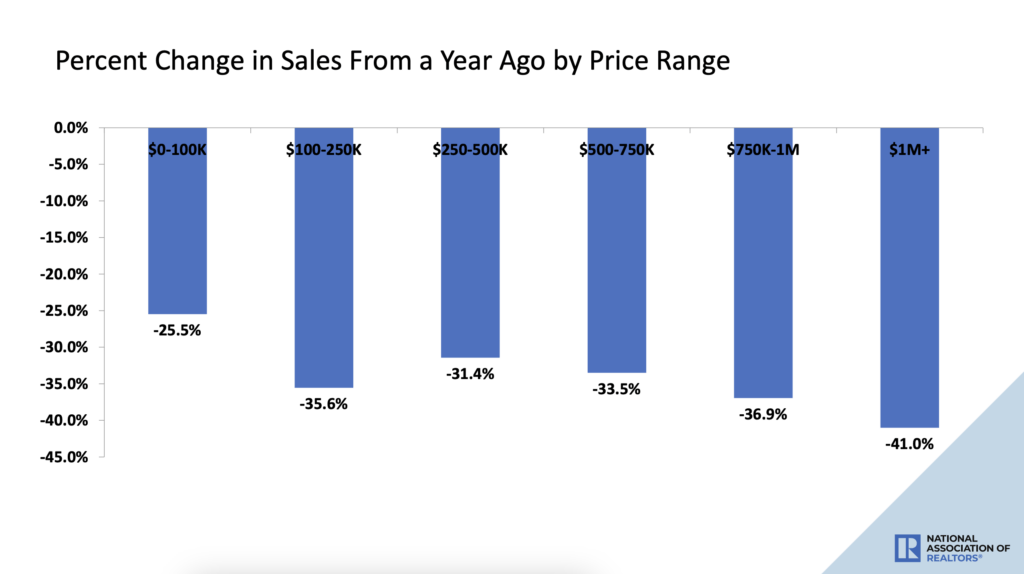
– This is down 0.7% from December and 36.9% from one year ago.
– Available inventory of homes to buy is super low. But prices are lower too.
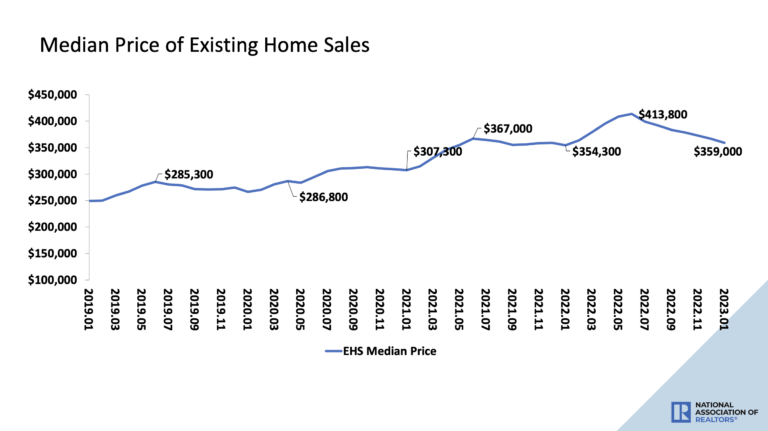
– The median price of existing homes sales price has dropped $54,800 from June peak of $413,800 to $359,000.
– This is an important trend because existing home sales are about 87% of all sales (new home sales are the rest).
– So a strong majority of homes for sale are lower in price.
– NAR uses median prices because they say average prices are skewed higher by a small share of high-priced sales.
– This downward price trend should give some relief to buyers, plus rates are down 0.5% from a 7.375% peak on October 20, 2022 to 6.875% today.
– Rates began February at 6% (on Feb 2), but then stubbornly high January CPI inflation caused rates to spike this month.
– Existing homes typically remained on the market for 33 days, and 54% of them sold within a month.
– First time buyers were 28% of sales, cash buyers were 26% of sales, and investors or second home buyers were 16% of sales.
– Here’s a chart on how sales have slowed by price ranges.

===
TAKEAWAYS: HOME PRICES AFFORDABLE
– So prices are down but speed of sales suggests decent demand.
– This means there are opportunities for buyers without a rout for sellers.
– Monthly cost on a $359,000 home purchase with 5% down and a 6.875% rate would be $2861 (mortgage payment, insurance, taxes, mortgage insurance).
– If you had no other monthly debt, you’d need to make $80k per year to qualify for this.
– If you had $600 in credit card, auto, and other monthly debt, you’d need to make $97k per year to qualify.
– Buyers holding for a home price crash may not see that.
– This might be a sweet spot for 2 reasons.
– First, demand and affordability will increase as inflation and mortgage rates calm.
– January inflation did drop, just not that much. Core CPI only dropped 10 basis points, from 5.7% to 5.6%. Hence ‘stubbornly high’.
– But the Fed is deeply committed to beating inflation, and rates will follow inflation down.
– Housing demand will rise as rates fall.
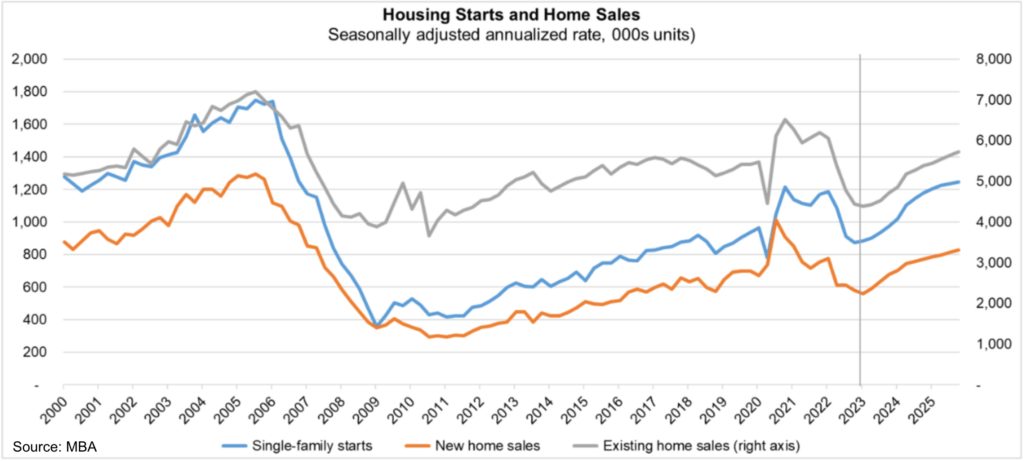
– Second, while 12 months of slowing sales will be the headlines, the MBA calls for home sales to turn up.
– Here’s the chart showing that trend. When this happens, home prices will rise again.

===
WHAT’S NEXT?
– This Friday, we’ll get January Core PCE, the Fed’s preferred inflation measure. This will signal rate direction ahead of Spring homebuying season.
– Come back Friday to see how that plays out.
– And please reach out with questions.
___
Reference:
– Existing home sales fell 0.7% in January, 12th straight decline (NAR)
– Mid-February Mortgage Rates Just Under 7%. Panic Time?
– No, homebuyers aren’t ‘royally screwed’ like misinformed media claims
