
How Much You Spend On Home Remodeling When Paying Cash vs. Financing

Harvard’s Joint Center for Housing Studies came out with its 2019 report on Improving America’s Housing today, which gets into detail on how much money you spend when improving your home. Below are a few notes and charts worth calling out on how much money Americans spend overall, what projects you’re doing, and the last section covers what you spend on home improvement projects when you’re paying cash vs. financing.
+++
– Almost 80% of America’s 137 million homes are at least 20 years old
– And 40% of America’s homes are at least 50 years old
+++
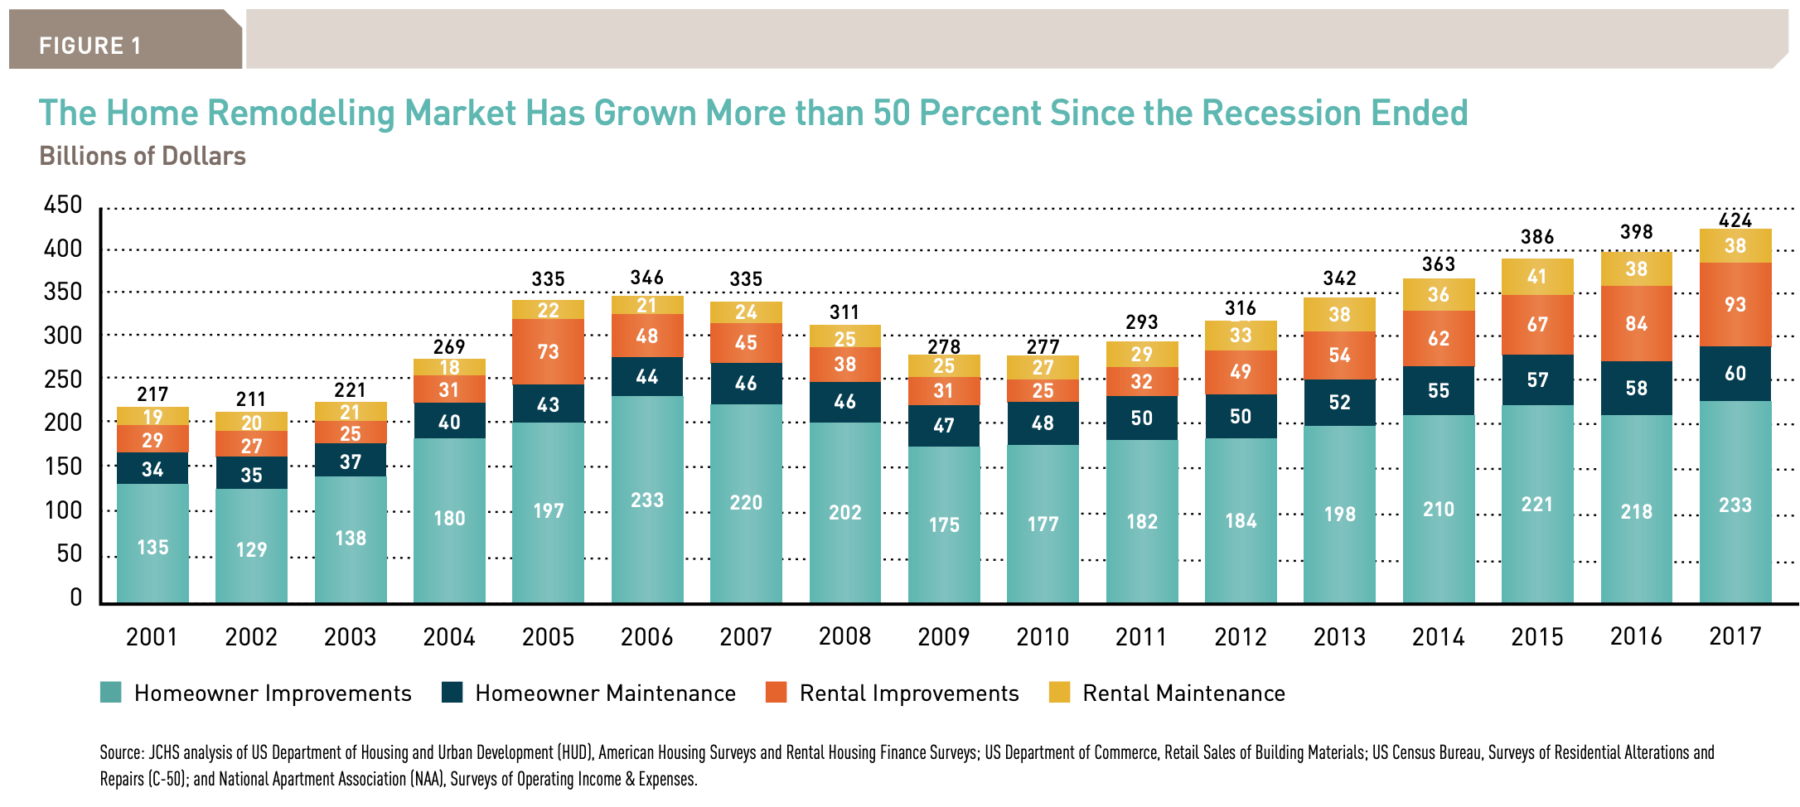
– Older/aging homes propelled home improvement industry to $425 billion in 2017, up 10% from 2015, and 50% from the low in 2010. CHART BELOW.
+++
– Tens of millions of projects—from roof and window replacements to major kitchen and bath remodels—generated 2.2% of national economic activity in 2017
– Increasing difficulty in building new affordable housing may keep this home improvement trend consistent in coming years.
– Also as you baby boomers enter their 70s and 80s, home modifications to improve accessibility are expected to soar.
+++
– Millions more are moving into homes you previously rented or kept vacant (5m conversions in 2010-11 vs. 6.6m in 2016-17) and you’re increasing spending to improve those homes (from $6500 per owner in 2010-11 to $7500 in 2016-17). TABLE BELOW.

– This means 1.6 million homes went from rentals/vacant to owner-occupied in 2016-17, which far outnumbers the amount of new single family homes that completed construction in 2016-17.
+++
– Homeowners 55 and older have spent the most on home improvement for almost 10 years, and homeowners 35–54 spend the most per household on average.
– 22 million homeowners completed at least one home improvement in 2017, with projects ranging from window/door replacement to heating/cooling upgrades to kitchen remodels or room additions.
– 40% of home improvers spent less than $2,500 in 2017, and owners those spending $50,000 or more contributed a third of national improvement spending.
+++
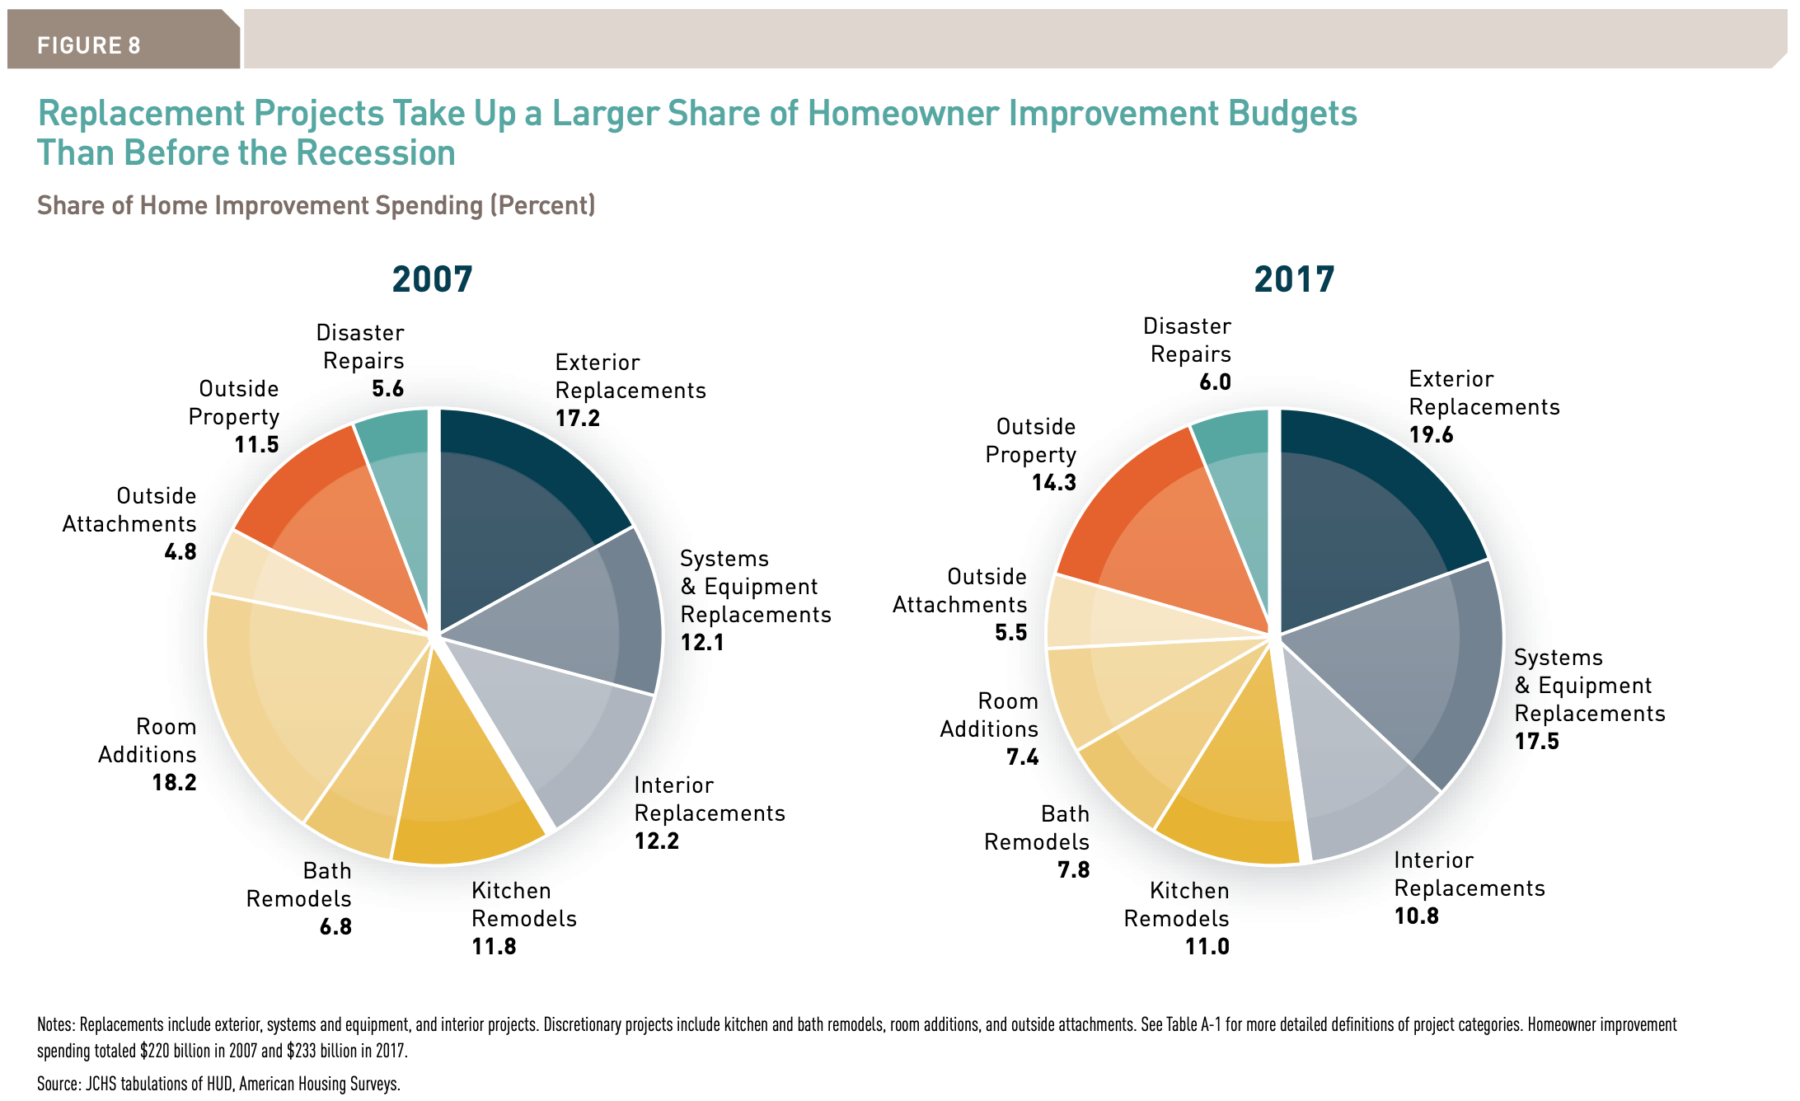
– CHART BELOW shows what you’re spending money on.
+++
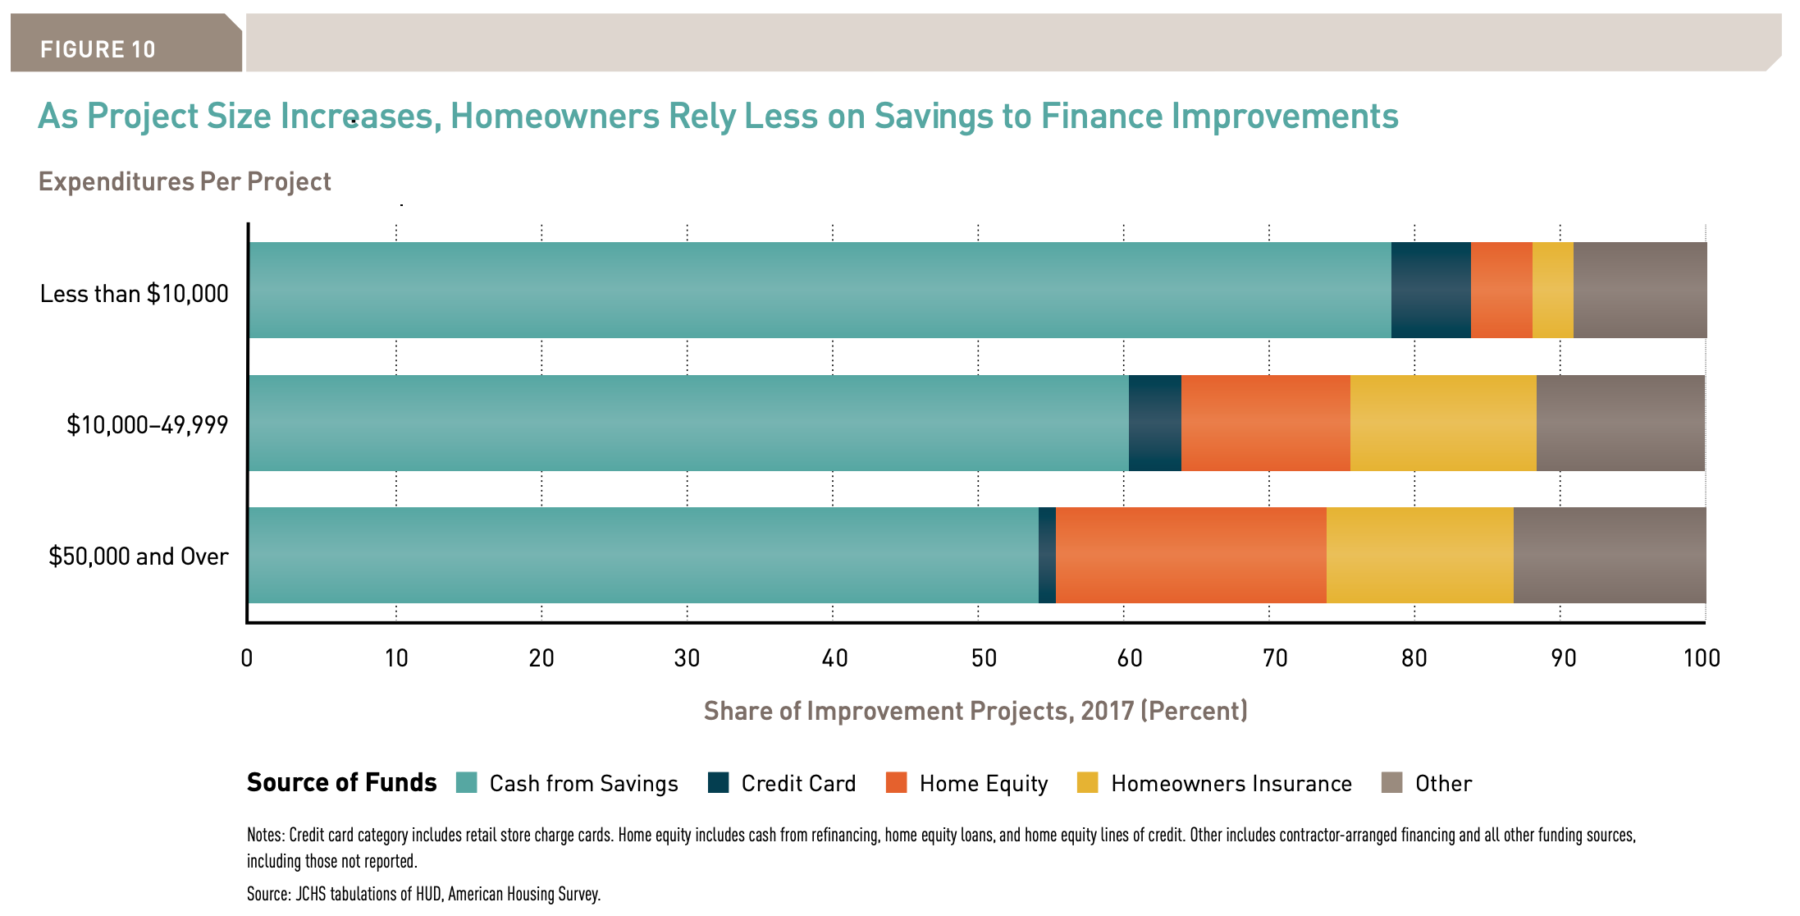
– Homeowners paid for 77% of home improvements with cash in 2017 (based on per-owner spending on home improvements averaging $3000 in 2017), but financing with credit cards or home equity rises as expenditures rise. CHART BELOW.
+++
– Home improvement contractors rule the day. 88% of homeowners 65 and over hired pros do their improvements, and 69% of homeowners under 35 hired pros.
– Average spending is about $3,300 when homeowners pay for improvements with credit cards, but rises to about $6500 when homeowners use contractor-arranged financing.
– Home improvement project spending increases to almost $7,500 if owners use a cash-out refinance, and rises to $9300 if owners use a home equity loan or HELOC.
– Also projects get larger when home equity or HELOCs are used. Average kitchen remodel cost jumps from $15,000 if funded with cash to $26,000 if funded with home equity or HELOC. Average bathroom jumps from $9000 to $15,000, and room additions jump from $22,000 to $43,000.
___
Reference:
– Improving America’s Housing 2019 – Harvard Joint Center For Housing Studies