
WeeklyBasis: Rates spike after April jobs report
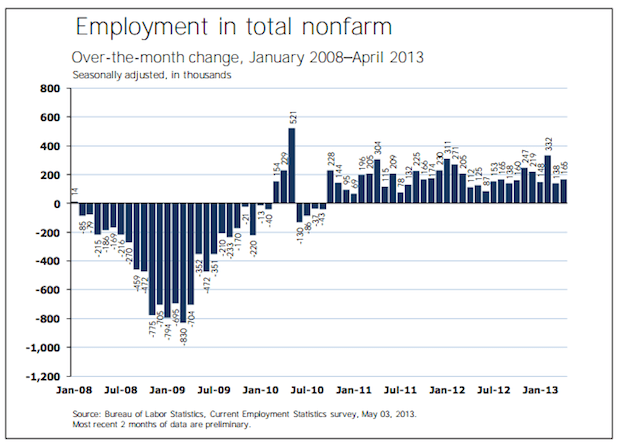
Rates are up today after a BLS report showed the U.S. economy added 165k nonfarm payrolls in April, above expectations of 145k, and March was revised up from 88k to 138k. Also February was revised up from 268k to 332k.
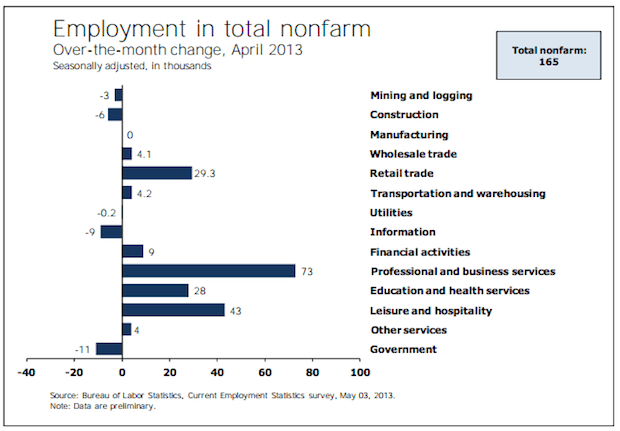
The April number plus March and February upward revisions brings the average monthly gain over the last 12 months up to 169,000. The chart above shows industries with biggest positive and negative impacts on payroll growth.
This non-farm payrolls figure is from the ‘Establishment Survey’ component of the jobs report which doesn’t count actual people, but rather counts how many companies opened or closed, then uses that data to estimate the number of jobs gained or lost.
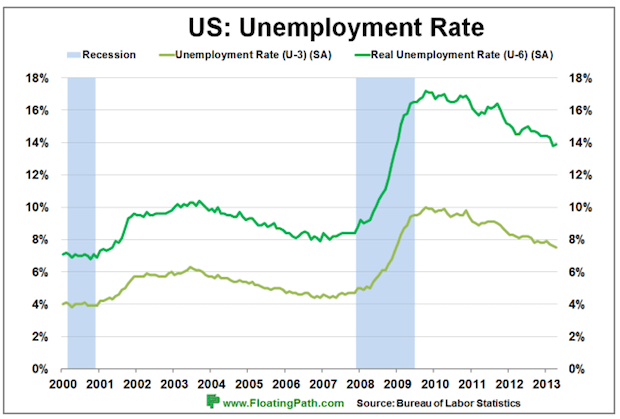
Unemployment dropped from 7.6% to 7.5% according to a different component of the jobs report called the ‘Household Survey’ which counts people. There are 11.7 million people unemployed. Plus another 7.9 million people are working part time because their hours were cut or they can’t find a full time job—this number increased 278,000 since March, which is bad. But this figure isn’t making headlines today.
Market reaction is bad for bonds/rates and good for stocks.
RATE REACTION
 Rates rise when mortgage bond (MBS) prices drop on a selloff, and this table* shows that selloff today in key Fannie Mae MBS coupons that lenders use as benchmarks for consumer rate pricing.
The Fannie 30yr 3% coupon is down sharply today after a big rally leading up to today. It’s now down 19 ticks (a tick is 1/32) to 104-03, erasing the gains made through Wednesday’s Fed meeting.
This reverses a rate dip that’s prevailed since the March jobs report came out April 5: rates are up about .125% today and could rise more if this selloff gains steam.
Rates hit lows for 2013 in the week leading up to today, and that dip is now erased. That said, rates are still quite low, and about .125% to .25% above record lows last touched mid-January.
2013 RATE RECAP
Rates started rising January 3 when markets interpreted December Fed meeting minutes as indicating that the Fed would end quantitative easing (aka QE, which is Treasury and mortgage bond buying to keep rates low) by the end of this year.
There was a brief reprieve as MBS recovered and rates touched all-time record lows (of 3.25% for a 30yr fixed loan up to $417k) for two days on January 15-16.
But then MBS selling resumed and rates were .375% above all-time record lows within a couple days, and they held that higher level until a couple factors started reversing the trend: the Fed reaffirmed a commitment to QE in March (and again Wednesday), and U.S. economic data was mediocre in March and April, taking the 10yr Note yield down with it—see chart in that link, and remember that MBS (and rates) follow the medium- and long-term trends of the 10yr Note.
But today’s jobs report has reversed that trend, and rates are up again. It’s now been proven repeatedly that MBS (Fannie 3s) can’t rally higher into the 105 range to bring rates back down to record lows, and this is a good reminder to rate shoppers to lock on the dips like we had Wednesday.
Including some other important rate and jobs report links below.
___
Reference:
– A Deep Dive On The April Jobs Report
– Jobs report CHART FEST – by FloatingPath
– $MBB, $TLT, $ZN_F, $TNX, $MACRO
*Table used with permission from MortgageNewsDaily