You Won’t Find Keys To Your Dream Home In A Chart


Every time part of your paycheck disappears into your landlord’s bank account, you probably hear a little voice in your head whispering “you should just buy a house…”
That voice knows buying a house is a better financial decision than renting. Homes appreciate over time—the opposite of other huge purchases like cars—and your money grows your own equity rather than your landlord’s pocket.
Buying is generally the better choice, and searching will help you learn how to figure this out for yourself. Real estate is local, so you’ll need to know how to ask the right questions in your local market.
Julian already wrote the be-all end-all post for figuring out your financials to make the rent vs. buy decision.
This post is a little different—it’s about how to digest new information so you don’t get confused along the way while you’ve made your decision (and even after).
Since most of us just aren’t experts on finance and real estate, headlines and data can influence our decision making in major and minor ways. If you read enough negative housing affordability articles, you’ll subconsciously get pessimistic about your chances to own a home one day.
However, if you understand the source data used in all these articles, you can keep your eyes on the prize.
That said, let’s look at some data. Realtor.com puts out a report every three months on whether renting or buying is more affordable. If you read it, you’d be tempted to think that buying isn’t what it’s made out to be.
Check out these stats:
The monthly mortgage payment for the U.S. median home was $1,578 in the fourth quarter of 2018, compared to the average monthly rent of $1,267
On average, buying the median home accounts for 31 percent of the national median income, while renting accounts for 25 percent
Fifty-one U.S. counties analyzed switched from being more affordable to buy to more affordable to rent in the last quarter of 2018.
You might be tempted to think renting’s not so bad after reading this. But once you come down from broad national stats to street level and apply your own financial profile, you’ll get more clarity. Let’s keep reading for key context:
The cost to purchase a home is still affordable (less than 30 percent of income) in 60 percent of larger counties, compared to 62 percent last year. However, as the inventory of homes available for sale in high cost areas has been increasing, the resulting increase to the national median listing price has nudged the cost to buy as a share of income from 29 percent to 31 percent over the past year.
That last sentence is key, and shows you how local thinking plays into the way you should think about housing.
If vacancies in the high-end housing market can raise the average cost of owning a home by 2%, you know something’s out of whack. The extreme high end of the market is wrecking the curve, so these averages can’t accurately describe the picture in your local market.
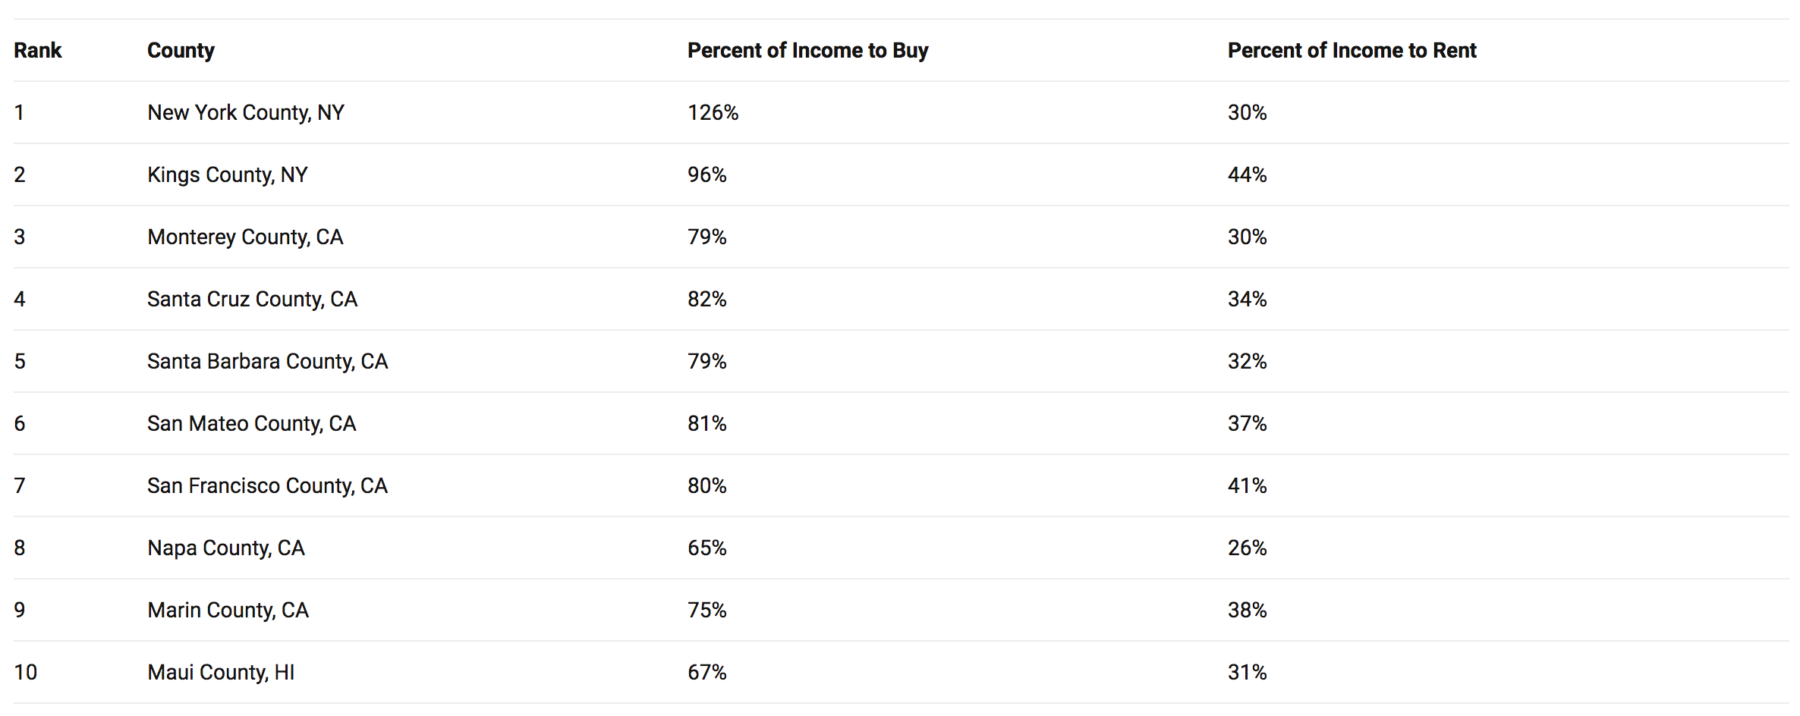
Like, look at where Realtor.com says renting is favored:
Wow, New York, California and Hawaii are expensive places to buy a house! No way!
Charts like this make you realize averaging out a huge housing economy is like house hunting out the window of a cross-country flight. So here’s a pro tip when reading housing stats: dig down to local details so the 30,000 foot view doesn’t crash your dreams.
___
Reference:
– House Hunting? Street Knowledge Beats Charts (The Basis Point)
– Rent vs. Buy: The Most Important Housing Decision Of All Time (The Basis Point)
– Free Your Mind From The Matrix of Home Affordability Headlines (The Basis Point)
– Q4 2018 Rent vs Buy Report (Realtor.com)

