Goldman Sachs U.S. Economy, Jobs, Housing Outlook 4 Months Into Coronavirus

It’s been 4 months since coronavirus got serious in the U.S. It’s felt more like a year, and we’ve had 49.17 million jobless claims from early March until last Thursday.
Needless to say, the NBER declared a recession earlier this month. Here’s a twitter thread for those interested in how recessions get declared.
THREAD:
On NBER saying today that America entered a recession in March (and exactly how NBER defines a recession)…
Peak monthly U.S. economic activity occurred in February 2020, marking end of an expansion that began in June 2009 and the beginning of a recession.
— Julian Hebron (@TheBasisPoint) June 9, 2020
GOLDMAN SACHS U.S. ECONOMIC OUTLOOK
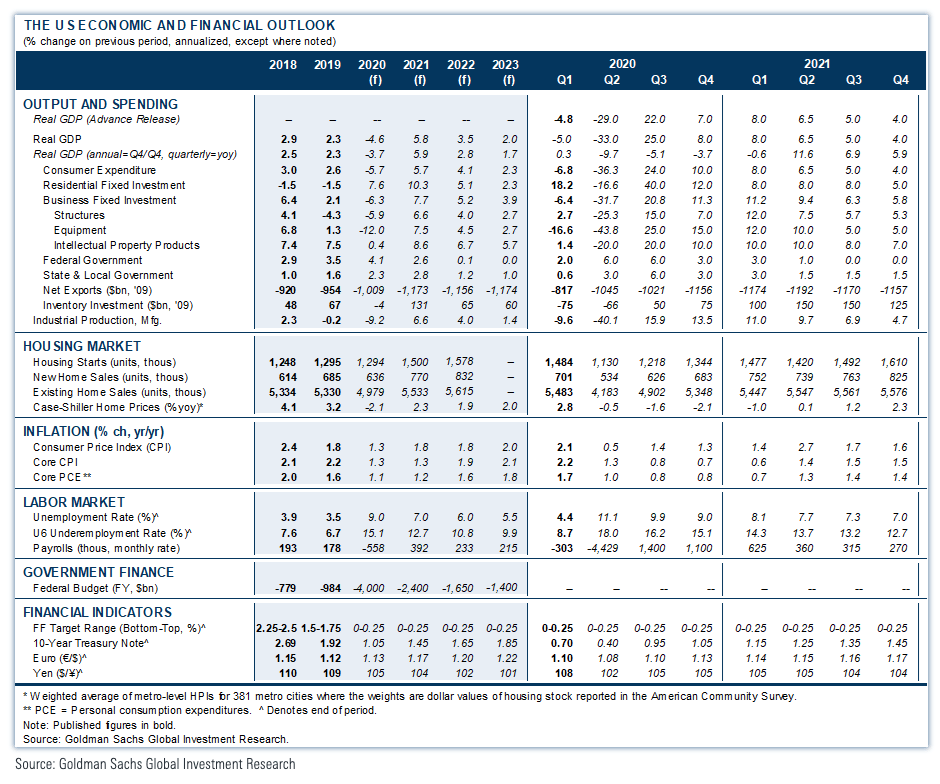
Below are a few key datasets on the economic outlook from Goldman Sachs’ economics team as of this week. And here are a few highlights I think are worth calling out.
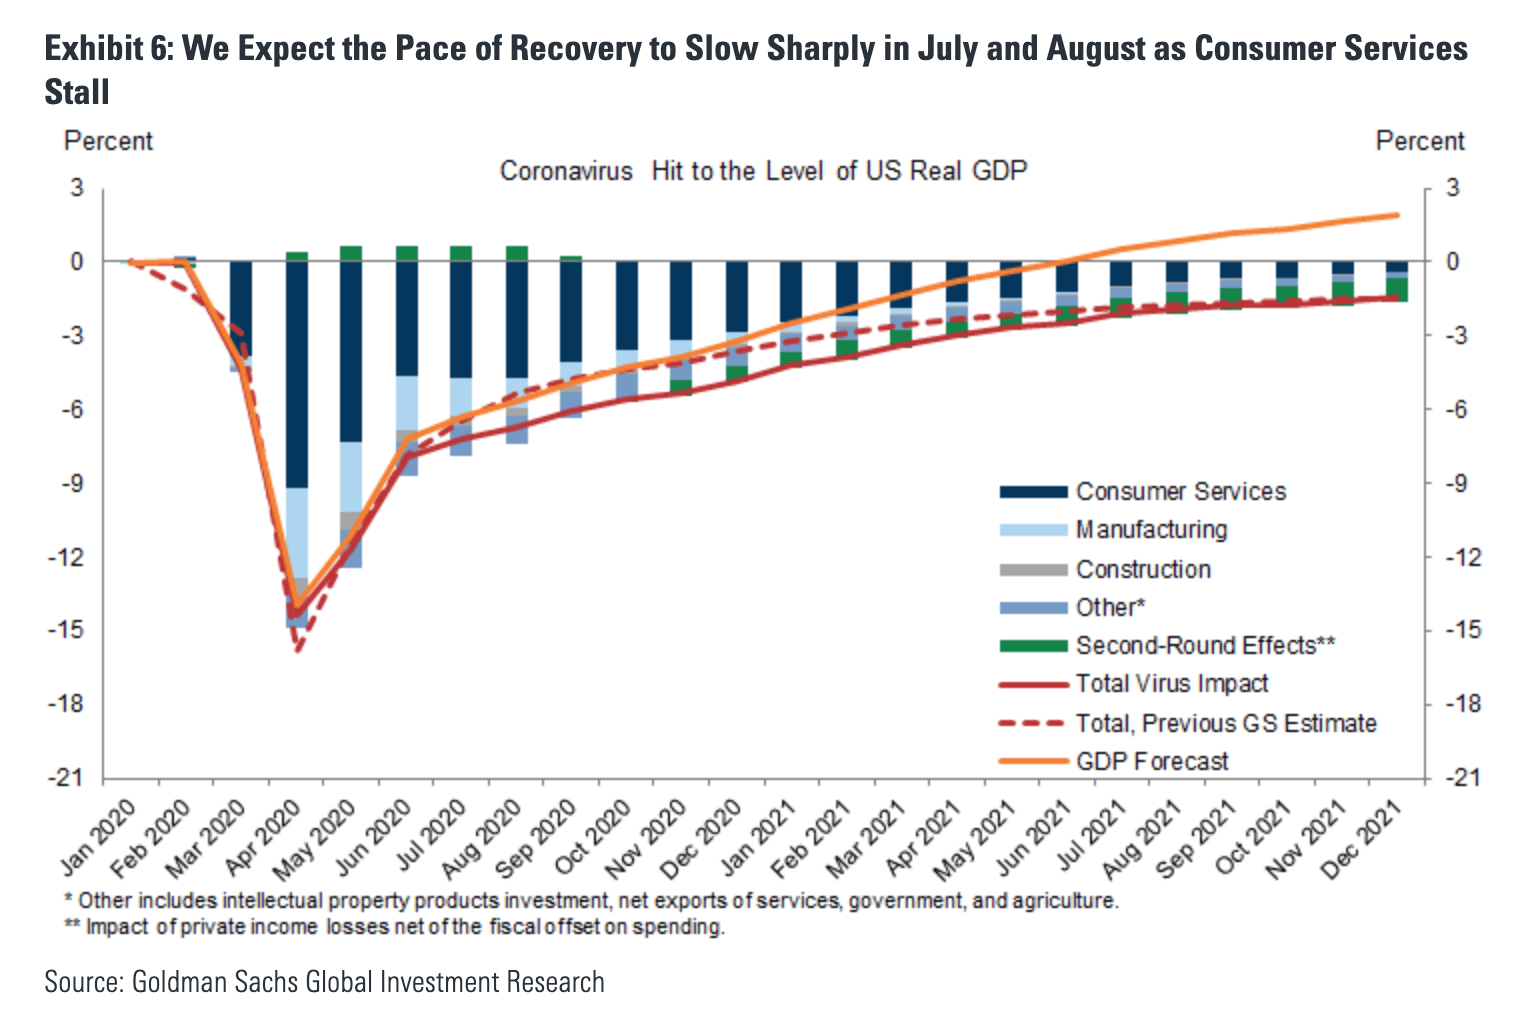
2020 & 2021 GDP
1Q 2020: -5.0%
2Q 2020: -33.0%
3Q 2020: +25.0%
4Q 2020: +8.0%
1Q 2021: +8.0%
2Q 2021: +6.5%
3Q 2021: +5.0%
4Q 2021: +4.0%
All 2019: +2.3%
All 2020: -4.6%
All 2021: +5.8%
2020 & 2021 JOBS GROWTH (Avg MoM change, thousands)
1Q 2020: -303
2Q 2020: -4429
3Q 2020: +1400
4Q 2020: +1100
1Q 2021: +625
2Q 2021: +360
3Q 2021: +315
4Q 2021: +270
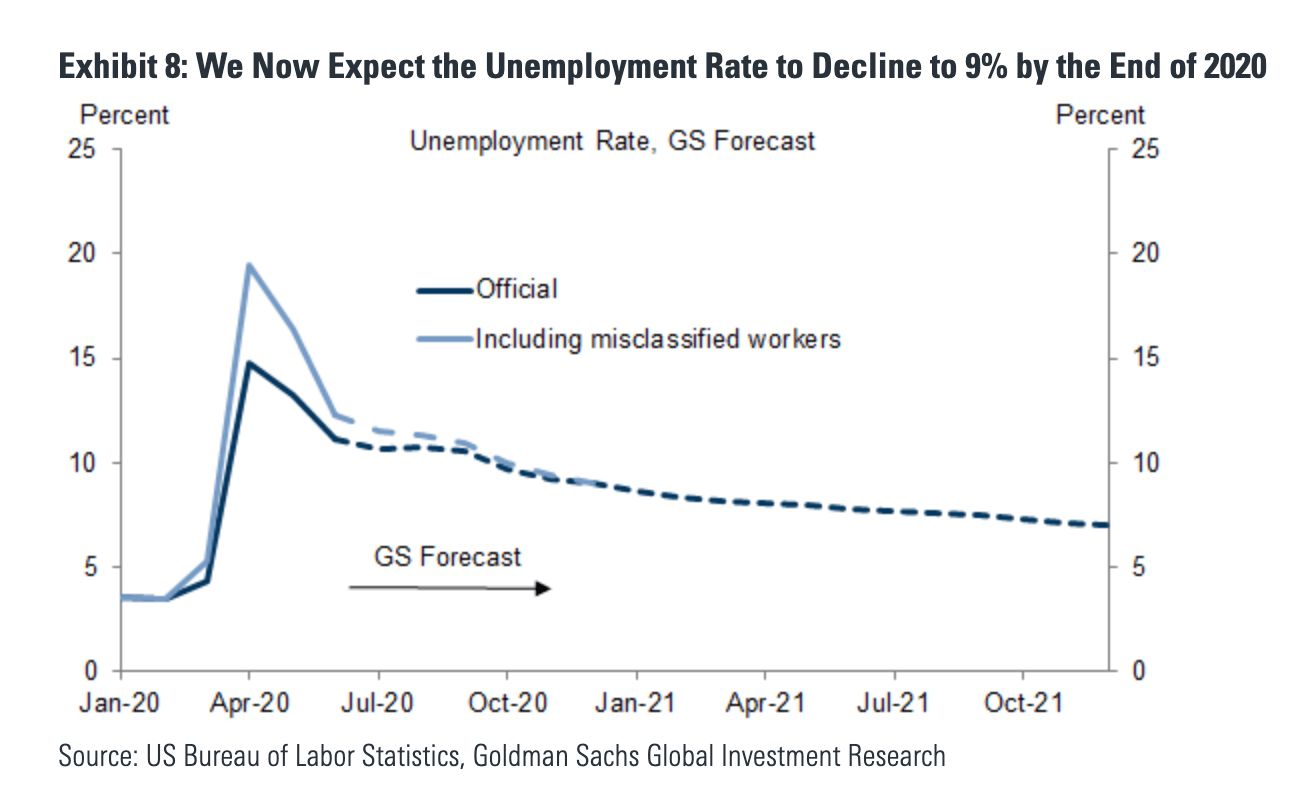
2020 & 2021 UNEMPLOYMENT RATE
1Q 2020: 4.4%
2Q 2020: 11.1%
3Q 2020: 9.9%
4Q 2020: 9.0%
1Q 2021: 8.1%
2Q 2021: 7.7%
3Q 2021: 7.3%
4Q 2021: 7.0%
All 2019: 3.5%
All 2020: 9.0%
All 2021: 7.0%
And you can go here to track weekly jobless claims in real time.
2020 & 1Q 2021 10-YEAR NOTE
1Q 2020: 0.70%
2Q 2020: 0.40%
3Q 2020: 0.95%
4Q 2020: 1.05%
1Q 2021: 1.15%
2Q 2021: 1.25%
3Q 2021: 1.35%
4Q 2021: 1.45%
EXISTING HOME SALES (units, thousands)
All 2019: 5330
All 2020: 4979
All 2021: 5333
NEW HOME SALES (units, thousands)
All 2019: 685
All 2020: 636
All 2021: 770
___
Related:
– Bank of America U.S. Economic Outlook 4 Months Into Coronavirus


