Calendar trick makes late mortgage payments spike 10.8% across America!

Late mortgage payments spike, millions more can refinance, and much more on the state of real estate and consumer finance from the Black Knight Mortgage monitor, hot off the spreadsheets today. Here are headline numbers, what they mean for you, and how calendar anomalies skew data.
BLACK KNIGHT MORTGAGE MONITOR RECAP, JUNE 2019
– Mortgage delinquencies (aka people with late mortgage payments) up 10.8% in June
– Foreclosure starts up 2.8% in June, but down 12% for Q2 2019
– In fact, quarterly foreclosure total is the lowest it’s been in 19 years
– Mortgage prepayments (including refinances) down 7.5%, meaning fewer loans paying off
– 8.2 million homeowners eligible for refinancing, 66% more than in May
– Lower rates mean homebuyers can buy home worth $45,000 more with same monthly payment (compared to November 2018)
– Mortgage defaults rose 3% from last quarter, the first post-financial crisis year-over-year increase
– 39/50 states saw default rates rise
– However, seriously delinquent loans (90+ days late on payment) are down 17% from last year
WTF IS UP WITH LATE MORTGAGE PAYMENTS?!
You might look at a nearly 11% jump in delinquencies (people late on mortgage payments) and be inclined to freak out.
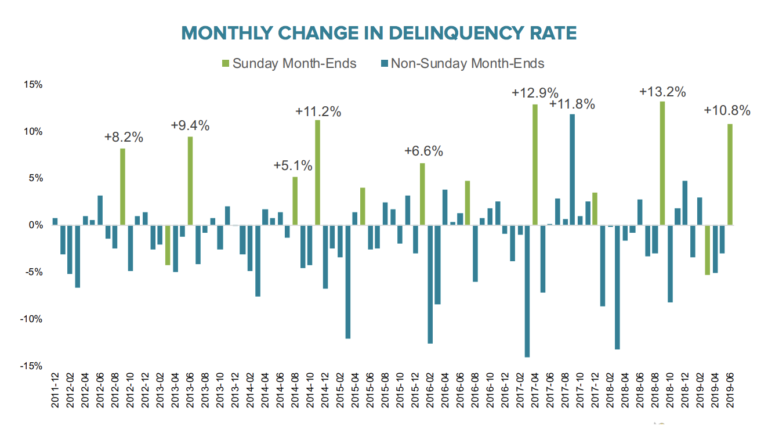
But a trick of the calendar led to some messy data. June ended in a Sunday, so lenders and servicers were closed the last two days of the month. These lenders couldn’t process payments from people who needed end-of-month paychecks to make their mortgage payments until July rolled around, so those mortgages technically became delinquent for June.
Black Knight has a handy graph on delinquency rates for months ending in Sundays, actually. Notice how they tend to drop drastically the month after a month ends in Sunday:
So this spike doesn’t necessarily show us weakness in mortgage. Black Knight goes deeper:
June has ended on a Sunday three times in the past 20 years; the last two (2002 and 2013) saw an average monthly delinquency rate increase of 11.1%, nearly identical to this year.
WHERE HOME PRICES HAVE RECOVERED & STAGNATED
But let’s not only focus on late mortgage payments. What about home prices?
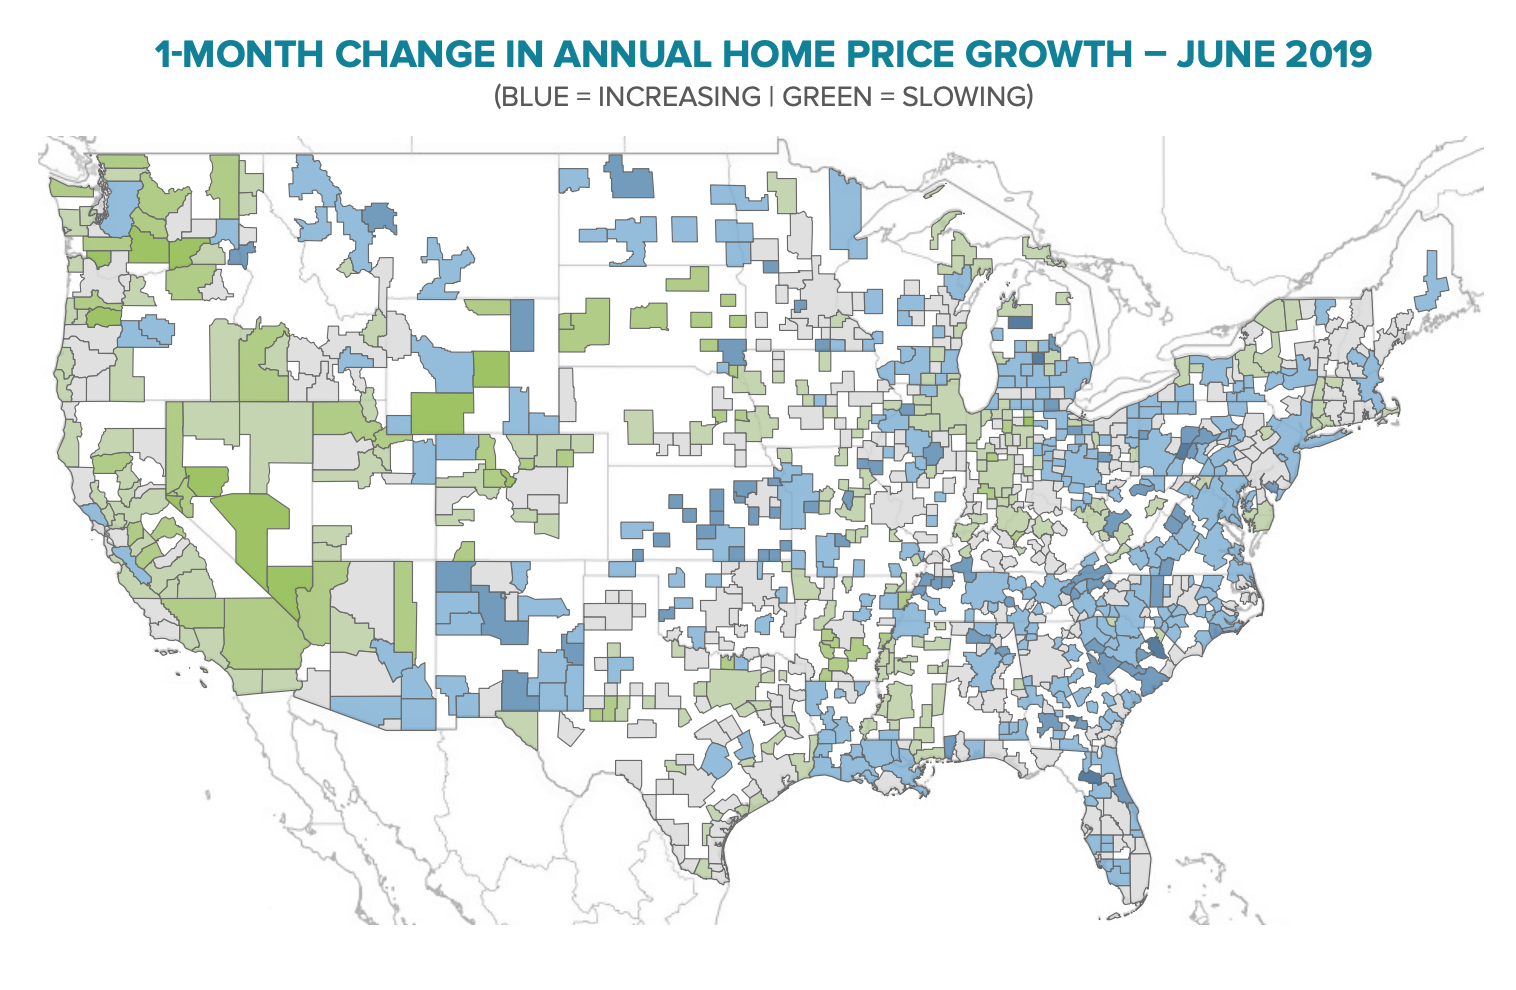
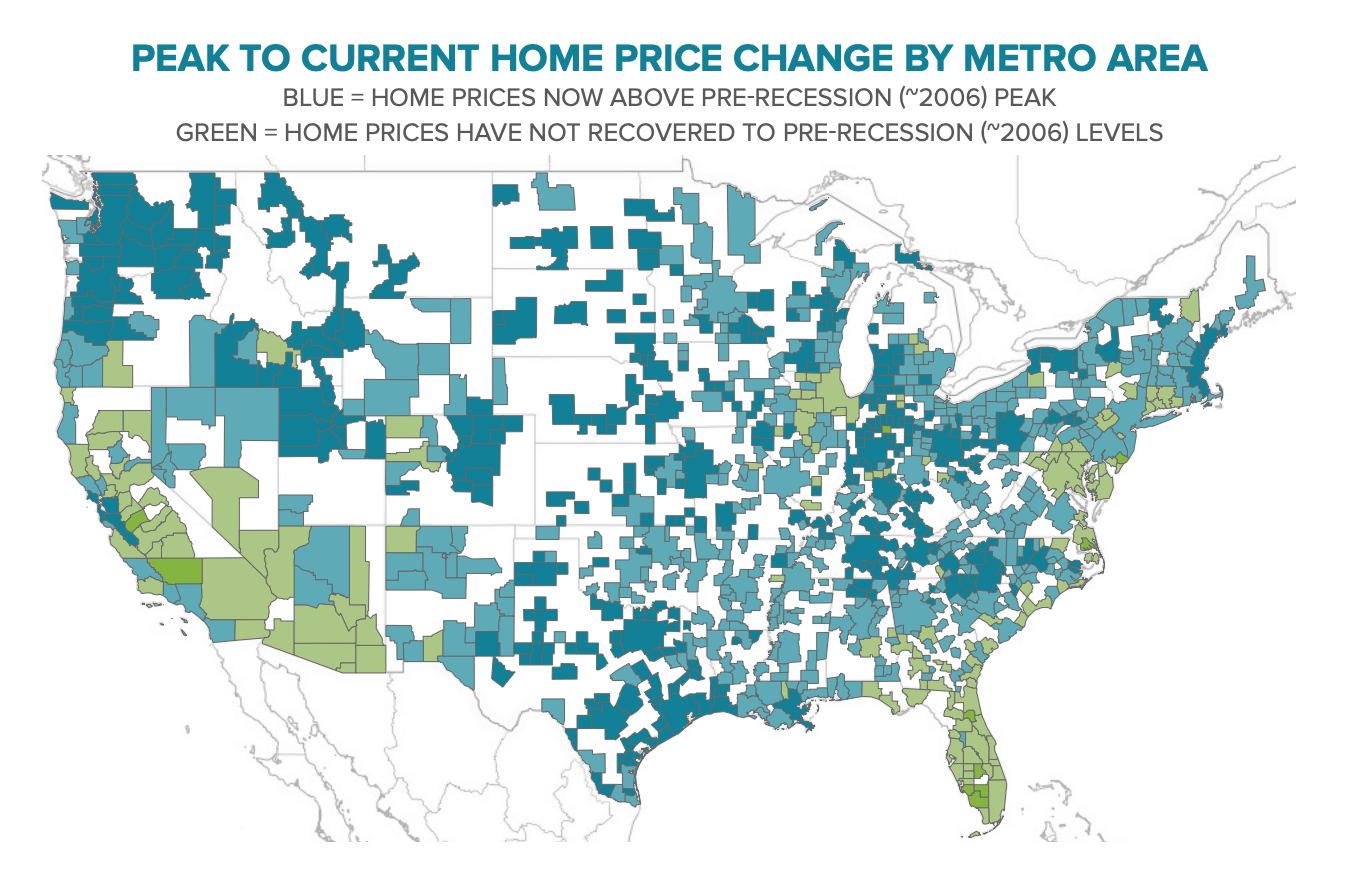
Below are two charts showing geographic breakdown of where home prices are increasing and slowing in the last month, and where home prices are above and below the pre-recession price peak.
REAL ESTATE MARKET HEALTH
This Black Knight Mortgage Monitor shows us a healthy housing economy.
Foreclosure totals are the lowest they’ve been in the 21st century.
Seriously delinquent loans are down nearly 20% from last year.
Low rates are giving homebuyers extra spending power.
However, a small rise in defaults is worth keeping an eye on.
The 3% rise in defaults was the first rise we’ve seen in the economic recovery since the financial crisis, but it’s not a canary in the coal mine yet.
___
Reference:
– 2019 Mortgage Refi Boom & Home Affordability – August Update
– 13 Reasons U.S. Real Estate Market Is Stronger Than You Think
– Pending home sales & home price data one-two punch of good news for homebuyers and sellers


